Effective data analysis in Excel begins with properly structured data that the system can easily process. If the data is poorly organized, formulas may break, PivotTables may generate errors, and analysts may spend unnecessary time fixing manual issues.
Before creating charts or dashboards, it is essential to follow a few core “Tidy Data” principles that ensure accuracy and efficiency.
- One variable per column: Each column should contain only one type of information. Avoid combining multiple values, such as a product name and price, in the same cell.
- One observation per row: Every row should represent a single, unique record, such as one customer order on a specific date.
- No visual formatting: Avoid merged cells, blank spacer rows, or decorative formatting within raw data.
- Separate data from presentation: Keep raw data in a clean sheet for analysis, and create dashboards or reports on a separate tab.
In this blog, we will explore the key steps to properly organize Excel data so it becomes reliable, analysis-ready, and easy to work with.
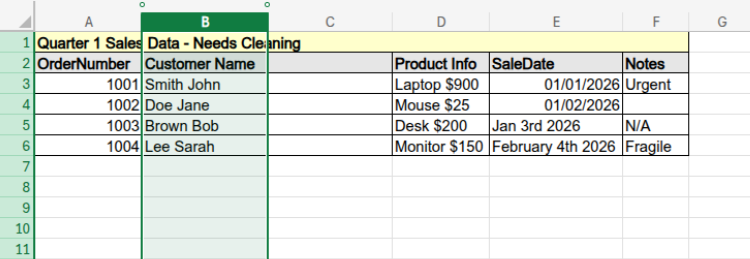
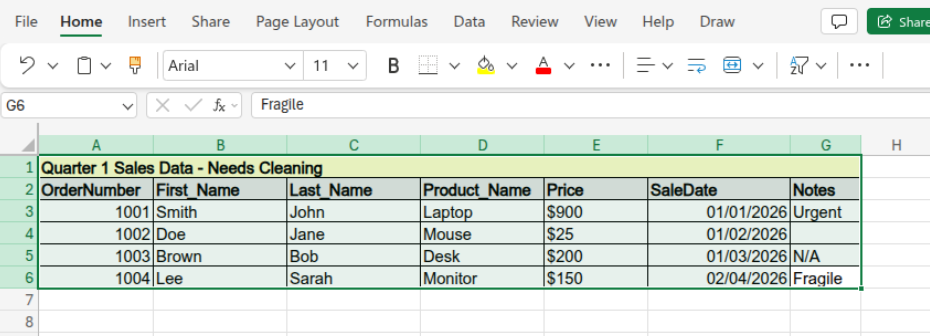
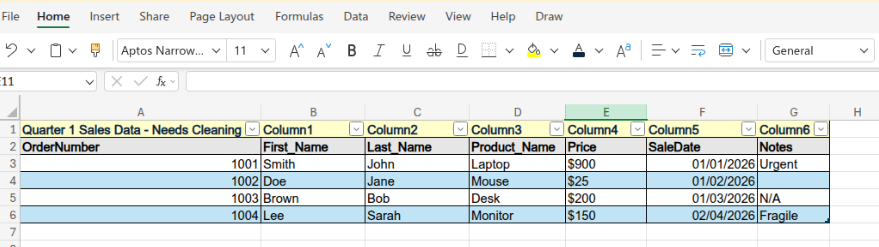
What Clean Data Looks Like?
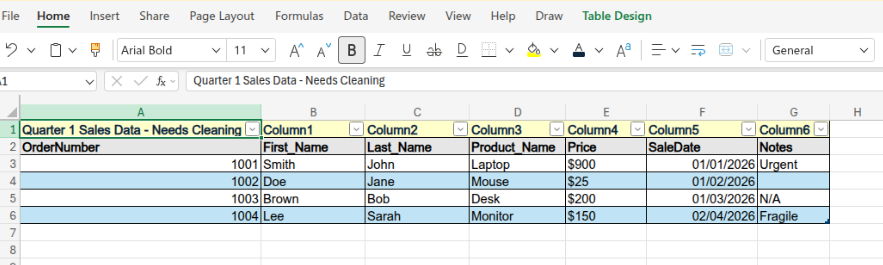
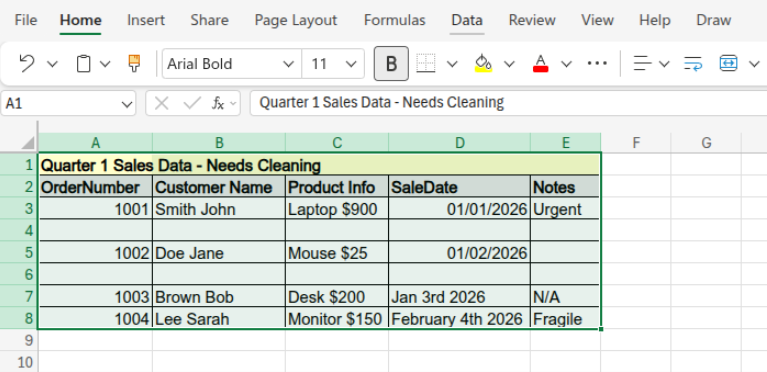
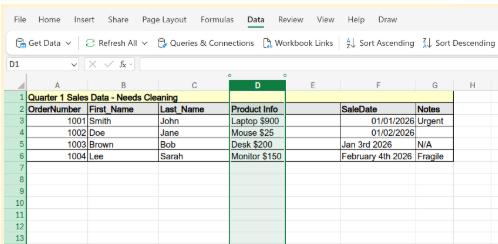
The image below is how your table should look once it’s organized.
To practice those exact steps, you will need a dataset that actually contains merged cells, completely blank rows, combined text, and inconsistent dates.
Because standard copy-pasting from a plain text window strips away "merged cell" formatting, the best way to get this into Excel exactly as you need it is to use a simple HTML file. Here is the perfect "messy" dataset custom-built for your practice routine.
Step-by-Step Guide to Organizing Data
How to import this into Excel for practice?
- Copy the HTML code below.
- Paste it into Notepad (Windows), TextEdit (Mac - make sure it's in plain text mode), Text Editor/Gedit if you are on Ubuntu.
- Save the file as practice.html.
- Double-click the file to open it in your web browser.
- Highlight the table in your browser, copy it (Ctrl + C), and paste it (Ctrl + V) directly into cell A1 in Excel.
<table border="1" style="border-collapse: collapse; width: 600px; font-family: sans-serif;">

  <tr>

    <td colspan="5" style="background-color: #ffffcc; text-align: center; font-weight: bold; padding: 10px;">

      Quarter 1 Sales Data - Needs Cleaning

    </td>

  </tr>

  <tr style="background-color: #e6e6e6;">

    <th>OrderNumber</th>

    <th>Customer Name</th>

    <th>Product Info</th>

    <th>SaleDate</th>

    <th>Notes</th>

  </tr>

  <tr>

    <td>1001</td>

    <td>Smith John</td>

    <td>Laptop $900</td>

    <td>1/1/2026</td>

    <td>Urgent</td>

  </tr>

  <tr style="height: 20px;">

    <td></td><td></td><td></td><td></td><td></td>

  </tr>

  <tr>

    <td>1002</td>

    <td>Doe Jane</td>

    <td>Mouse $25</td>

    <td>1/2/2026</td>

    <td></td>

  </tr>

  <tr style="height: 20px;">

    <td></td><td></td><td></td><td></td><td></td>

  </tr>

  <tr>

    <td>1003</td>

    <td>Brown Bob</td>

    <td>Desk $200</td>

    <td>Jan 3rd 2026</td>

    <td>N/A</td>

  </tr>

  <tr>

    <td>1004</td>

    <td>Lee Sarah</td>

    <td>Monitor $150</td>

    <td>February 4th 2026</td>

    <td>Fragile</td>

  </tr>

</table>
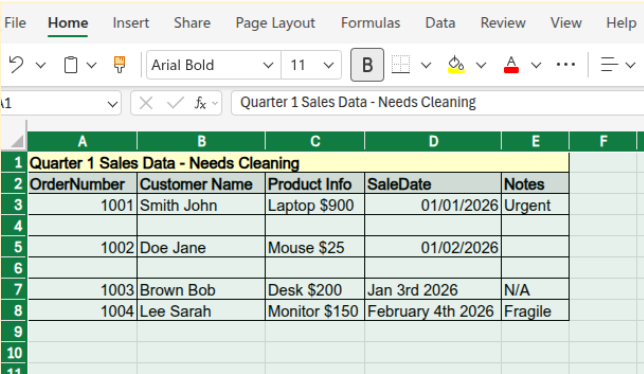
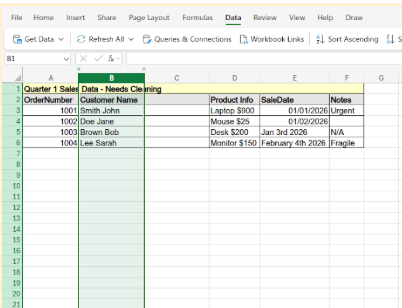
Once you paste this into Excel, it will have the exact errors you need to fix: a merged header blocking sorting/filtering, empty rows breaking the dataset, joined names and product prices, and mixed date formats.
Step 1: Remove Merged Cells
Merged cells interfere with data analysis because Excel cannot properly sort, filter, or structure data when cells are combined.
Procedure:
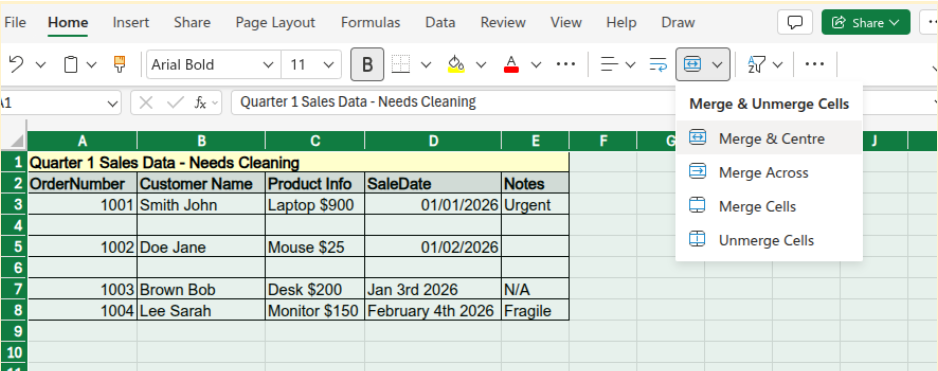
- Press Ctrl + A to select the entire worksheet.
- Navigate to the Home tab.
- Click the Merge & Center icon (or click the dropdown and select Unmerge Cells) to disable any merged cells.
Important Note:
If merged cells were previously used to display a category or group label, fill the newly empty cells with the correct value so that every row contains complete information.
Step 2: Remove Blank Rows
A completely empty row can interrupt Excel’s ability to recognize a continuous dataset. This may cause issues when creating PivotTables, filters, or charts.
Procedure:
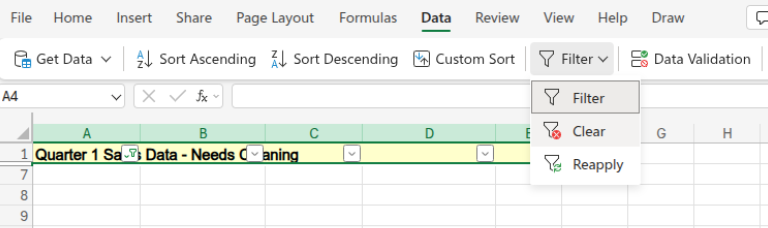
- Select the full data range.
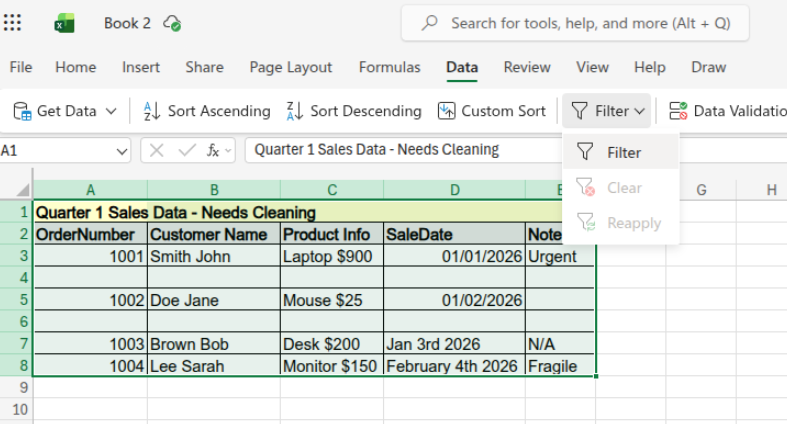
- Open the Data tab and click Filter.
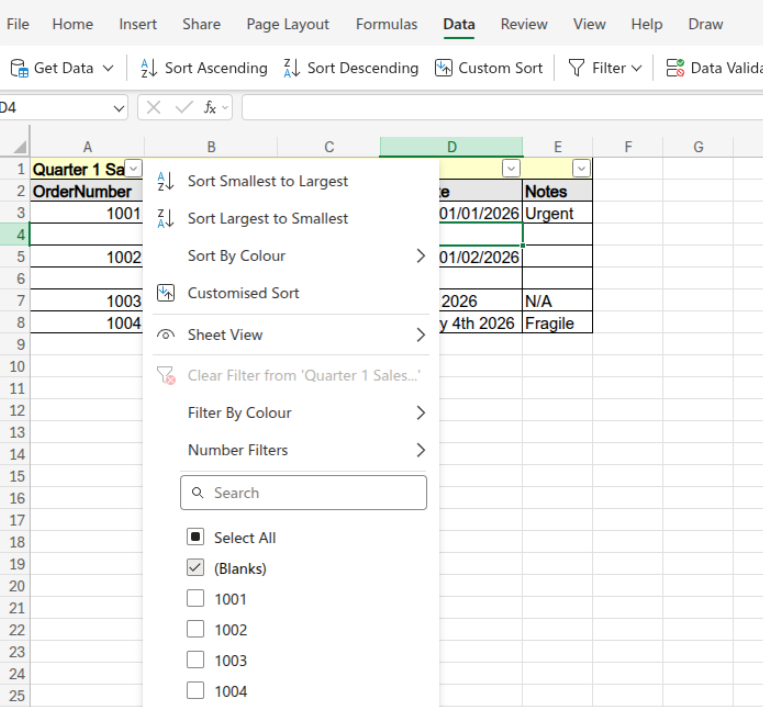
- Use the filter arrow on a column and select only (Blanks).
- Highlight the visible blank rows.
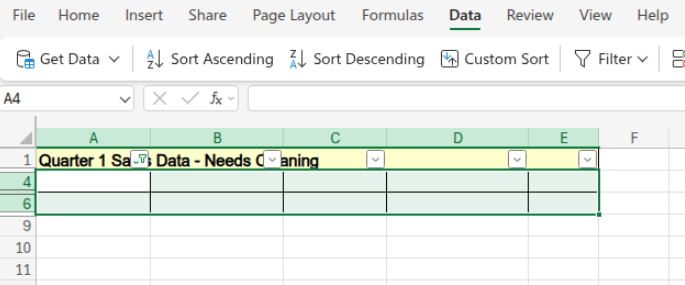
- Right-click and choose Delete Row.
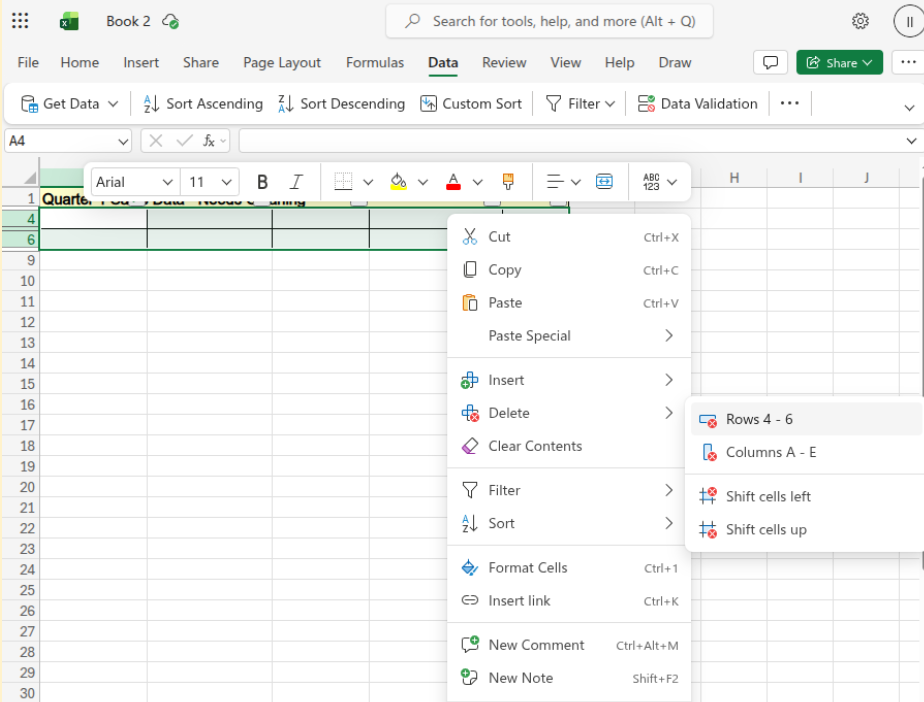
- Clear the filter to restore the full dataset.
Removing blank rows ensures that Excel treats the dataset as one continuous table.
Step 3: Separate the Customer Name Column
The Customer Name column contains both the first and last names within a single cell (for example, “Smith John”). For proper data organization, these values should be stored in separate columns.
Procedure:
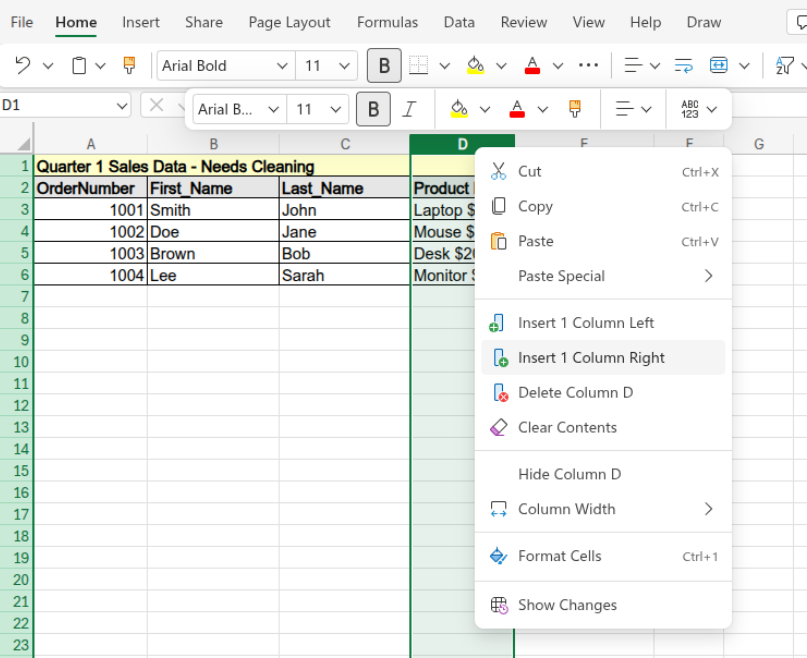
- Insert a blank column immediately to the right of the Customer Name column.
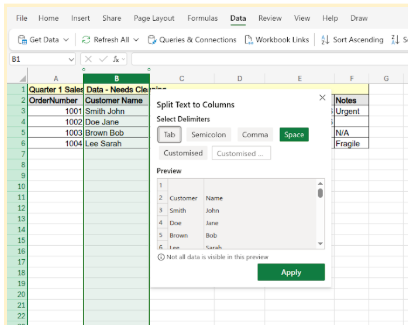
- Select the Customer Name column.
- Go to the Data tab and click Text to Columns.
- In the pane that opens, select Space as the delimiter, and click Apply.
After splitting the column, rename the fields to Last_Name and First_Name, then rearrange them if necessary so the dataset follows the First_Name → Last_Name format.
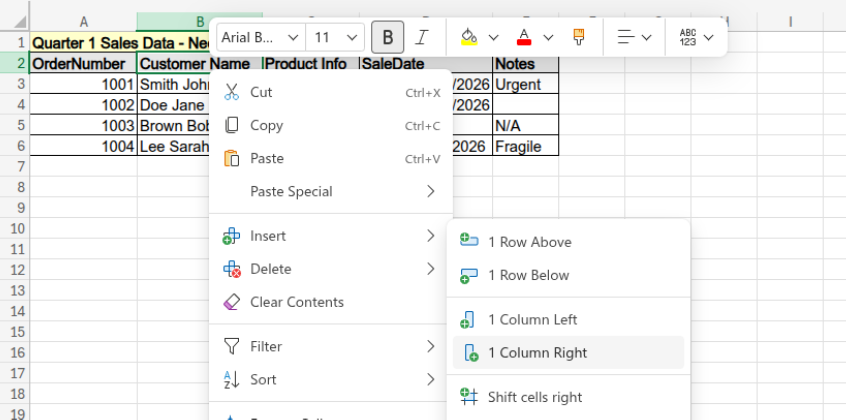
Step 4: Separate Product Name and Price
The Product Info column combines two different values (for example, “Laptop $900”). Because Excel treats this as text, the price cannot be used in calculations until it is separated.
Procedure:
- Insert a blank column immediately to the right of the Product Info column.
- Select the Product Info column.
- Go to the Data tab and click Text to Columns.
- Select Space as the delimiter.
- Click Apply.
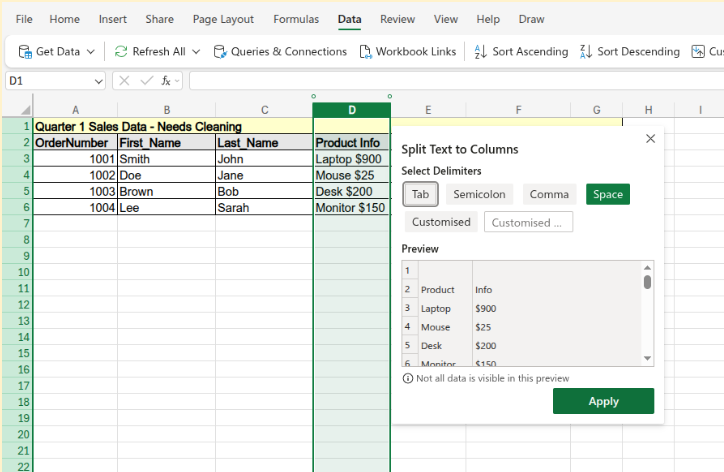
Rename the resulting columns as Product_Name and Price, and remove the currency symbol if necessary so the Price column contains numeric values.
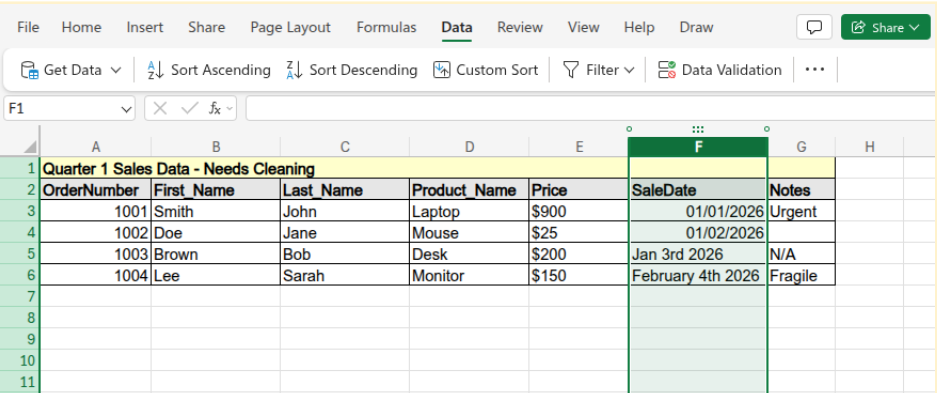
Step 5: Standardize the Date Format
Dates may appear in different formats within the dataset (for example, “Jan 3rd 2026” versus “1/3/2026”). Inconsistent formats may prevent Excel from recognizing them as valid date values.
Procedure:
- Select the SaleDate column.
- Navigate to the Home tab.
- Locate the Number Format dropdown menu.
- Select Short Date.
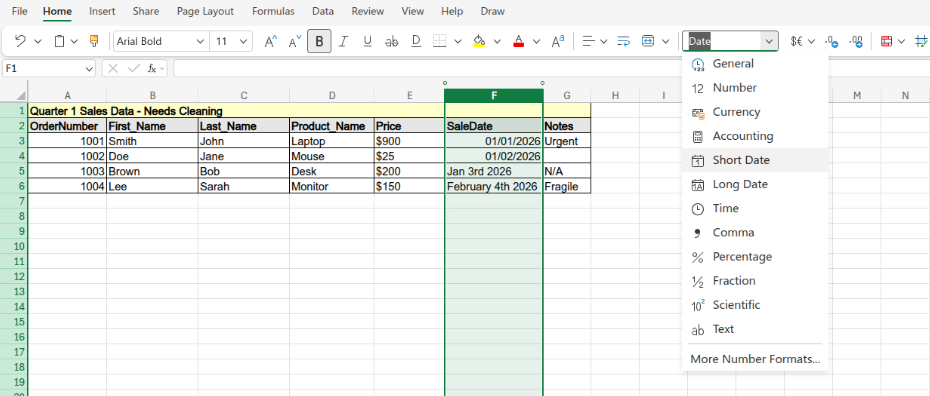
If any entries do not convert automatically, re-enter them using a standard MM/DD/YYYY format so that all dates are consistent.
Step 6: Convert the Dataset into a Table
After the dataset has been cleaned and properly structured, converting it into an Excel table improves organization and allows Excel to manage the data more efficiently.
Procedure (Excel Online):
- Select the entire dataset, including the header row.
- Go to the Insert tab in the ribbon.
- Click Table (or use the keyboard shortcut Ctrl + L).
- Check the box that says "My table has headers" and click OK.
Excel will automatically convert the selected range into a table. Once the table is created, filter arrows will appear in the header row, allowing you to sort and filter the data.
Benefit:
Excel tables automatically expand when new rows are added. As a result, charts, formulas, and PivotTables update automatically without requiring manual adjustments to the data range.
If you want to reinforce your learning and test your understanding of Excel concepts, try this Excel Quiz to evaluate your spreadsheet knowledge. Mastering these foundational data cleaning steps is essential for any professional working with spreadsheets.
If you are looking to build upon these skills and dive deeper into advanced analytical techniques, you might find courses like Master Data Analytics in Excel that cover topics such as data cleaning, advanced formulas, PivotTables, data visualization, and real-world business analysis projects.
Learn Excel for powerful data analysis and enhance your skills for better decision-making.
Such programs help learners move from basic spreadsheet usage to performing structured data analysis and generating insights for decision-making.
Common Data Entry Errors to Stop Making
If you want to protect your clean foundation, you must eliminate these terrible habits at the data entry stage:
- Stop using color as data: Highlighting a cell yellow to indicate "Pending" is useless for analysis. Excel formulas cannot easily sum background colors. You must create a dedicated "Status" column instead.
- Stop mixing units: Do not type "USD 500" in a single cell. Put the numeric "500" in one column and the text "USD" in a completely separate column.
- Stop using spaces to indent: Pressing the spacebar to center text creates invisible trailing spaces. These spaces cause lookup formulas like VLOOKUP to fail completely.
Handling Complex Scenarios: Survey Data and Automation
Once you have the basics down, you need to know how to handle specific formatting challenges and automate your weekly workflow.
1. Managing Questionnaire Feedback
Figuring out how to organize survey data in Excel comes with its own unique challenges. Survey platforms usually export messy combinations of long text blocks and skipped fields.
- Assign a Unique ID: Always create a "Respondent ID" as your very first column so you never lose track of individual submissions.
- Use Numeric Codes: Convert long text responses like "Strongly Agree" to a 1 to 5 numeric Likert scale. Keep a separate "Data Dictionary" tab to track what each number actually means.
- Use Dummy Variables: If a question says "Check all that apply," do not group the answers into one cell. Create a new column for every single possible answer choice. Put a "1" if the user selected it, and a "0" if they did not.
2. Automation and Error Prevention
When you are going through the processes of cleaning these parts manually on a weekly basis, you are wasting time.
- Automate with Power Query: With the help of the Power Query tool, a feature of Excel, you can authenticate to your spacious data and log your cleaning actions. The second time that you will find yourself being presented with a file, you just have to click on refresh, and Excel will clean up the newly given data on its own.
- Prevent Data errors: Highlight a column and select the Data validation tool and create a strict drop-down menu of approved terms. This completely removes mistakes and discrepancies prior to their occurrence.
- Use Conditional Formatting for Instant Error Detection: Apply conditional formatting rules to quickly identify unusual values, duplicates, or missing entries. For example, you can highlight duplicate OrderNumbers or flag prices that fall outside an expected range. This allows data issues to be spotted immediately instead of being discovered later during analysis.
- Reshaping Wide Survey Data: Survey tools often export data in a wide format, where every question appears as a separate column. While this may seem organized, it becomes difficult to analyze when the survey contains dozens or even hundreds of questions.
3. Reshaping Wide Survey Data
Survey tools often export data in a wide format, where every question appears as a separate column. While this may seem organized, it becomes difficult to analyze when the survey contains dozens or even hundreds of questions.
- Unpivot Question Columns: Instead of keeping each question in its own column, convert the dataset into a long format where responses are stacked vertically. This creates a structure with columns such as "Respondent ID," "Question," and "Response," making the data much easier to summarize in PivotTables.
- Use Consistent Question Labels: Rename survey question headers into short standardized labels such as "Q1_Satisfaction" or "Q2_Recommendation." Clear naming conventions help prevent confusion when the dataset grows larger.
- Group Related Questions: If your survey contains multiple sections (for example Product Feedback, Customer Support, and Pricing), use a dedicated column called "Category" so questions can be grouped during analysis.
4. Handling Missing and Skipped Responses
Missing data is extremely common in survey datasets because respondents frequently skip questions or abandon surveys before completion. If these gaps are not handled properly, calculations such as averages and percentages can become misleading.
- Identify True Blanks: Determine whether a blank cell means the question was skipped or if the survey platform simply exported an empty value. These situations should be handled differently during analysis.
- Use Standard Missing Value Codes: Instead of leaving cells empty, many analysts use codes such as "-99" for missing responses or "-88" for "Not Applicable." This makes it easier to filter these values out when calculating results.
- Track Completion Status: Add a "Survey_Status" column to label responses as "Complete," "Partial," or "Abandoned." This allows you to quickly filter incomplete submissions when performing analysis.
5. Building a Repeatable Data Import Process
If you receive survey exports every week or every month, manually repeating the same cleaning process becomes inefficient. Instead, you should design a workflow that allows Excel to perform these steps automatically.
- Store Raw Files Separately: Always keep the original survey export files in a dedicated "Raw_Data" folder. Never modify the original dataset directly.
- Create a Power Query Import: Connect Excel to the folder containing the survey exports using Power Query. Once the connection is created, you can apply your cleaning steps only once.
- Refresh Instead of Repeating Work: When new survey files arrive, simply place them in the folder and click "Refresh." Excel will automatically apply the same cleaning steps, saving hours of manual work and ensuring the dataset remains consistent.
Conclusion
Poor performance can be avoided through proper preparation. This is especially applicable to spreadsheet management. It is not possible to derive meaningful and accurate insights from a disorganized dataset.
Taking the time to learn about the correct structural rules and by practicing from the very beginning, you can lay a solid foundation of long-term success. This method saves a lot of time in solving problems like broken PivotTables and formula errors.
Instead, it is possible to spend more time on determining useful patterns and key performance indicators significant to the organization.
Before you close out of your next spreadsheet, remember these final takeaways:
- Treat raw data like a foundation: Keep it strictly separated from your final visual reports.
- Stick to the rules: Enforce one variable per column and one observation per row every single time.
- Automate your workflow: Let tools like Power Query handle the repetitive weekly cleaning steps.
When raw data is handled with this level of care and attention, Excel becomes a highly powerful tool for data analysis.