Distracted Driver Monitoring System Using AI
According to a study, driving while distracted accounted for more than 15% of fatalities in 2008 in the United States. In 65.5% of these cases, the driver was alone in the cab. As all accidents cannot be monitored, the actual number of incidents and fatalities due to driver distraction can be significantly higher than the accounted incidents and fatalities. Some vehicles now come equipped with advanced driver assist systems (ADAS) to provide automated safety. ADAS uses a combination of sensors such as LiDAR, IR cameras, Radar, ultrasonic sensors and Visual spectrum cameras to perform object detection ang get a situational awareness of the vehicle. Based on this, the ADAS system assist the driver or can take emergency action independently to avert a collision. Owing to the cost of ADAS systems, they are available only in premium cars. This paper explored design and development challenges to create an inexpensive, modular solution to monitor driver's and provide an alert when prolonged distraction is detected. This is not a substitute for a commercial ADAS system but a step towards low-cost driver safety options. Because of its modularity and use of commodity-class hardware, the system should be easy to retrofit in any car at an affordable price.
I. INTRODUCTION
This paper focuses on solution options for driver image segmentation and detection of key distraction indicators. This involves a combination of artificial intelligence and traditional coding techniques. We propose a real-time monitoring system to classify a drivers distraction level. The key performance indicator is the model accuracy in distinguishing safe driving from distracted driving behaviours.
The IEEE paper on "Machine Learning and End-to-End Deep Learning for Monitoring Driver Distractions from Physiological and Visual Signals" [5] provides an analysis for the determination of which ML methods perform best in detecting various driving distractions. The paper includes which sensors and which data-capture methods were used with a focus on
- Physiological sensors (palm electrodermal activity (pEDA), heart rate and breathing rate)
- Video cameras (eye tracking, pupil diameter, nasal EDA (nEDA))
The statistical analysis showed that the most informative feature/modality for detecting driver distraction depends on the type of distraction. Overall, the video-based modalities were most informative and classical Machine Learning classifiers realized high performance using one of the video-based modalities. In contrast, the Deep Learning classifiers require more modalities (either all modalities or pre-selected modalities) for the construction of useful classifiers [5].
![Figure 1 - Multi Modality DL fusion [5]](https://www.mygreatlearning.com/blog/wp-content/uploads/2025/12/Figure-1-Multi-Modality-DL-fusion-5.png)
Using a Pre-trained ImageNet model (VGG-16 architecture for applying transfer learning) and modifying the classifier for the task of distracted driver detection achieved an accuracy of 82.5% [6].
Other approaches [15] utilize combinations of pre-trained image classification models (CNN), classical data augmentation, OpenCV based image pre-processing[11][3], skin segmentation augmentation, VGG-16, GoogleNet, AlexNet, and ResNet. Experiments were conducted on the assisted driving test bed to evaluate the trained models [8] to achieve the following accuracies:
| Model | Accuracy, % | Max frequency, Hz |
|---|---|---|
| VGG | 86 | 14 |
| AlexNet | 88 | 12 |
| GoogleNet | 89 | 11 |
| ResNet | 92 | 8 |
Systems [9] for detecting states of distraction in drivers during daylight hours using machine vision techniques, which is based on the image segmentation of the eyes and mouth of a person with a frontface-view camera achieved performance accuracies of 90%. A decision concerning the state of the driver is the result from a multilayer perceptron-type neural network with all extracted features as inputs [7][9].
A solution consisting of a genetically weighted ensemble of convolutional neural networks is also available [10]. The convolutional neural networks[14] are trained on raw images, skin-segmented images, face images, hands images, and "face+hands" images. On those five images sources, training and benchmarking was done on an AlexNet network, an InceptionV3 network, a ResNet network having 50 layers, and a VGG-16 network. An evaluation of a weighted sum of all networks' outputs yielded the final class distribution[16] using a genetic algorithm achieving an overall accuracy of 90%.
![Figure 2 - Ensemble CNN Architecture [10]](https://www.mygreatlearning.com/blog/wp-content/uploads/2025/12/Figure-2-Ensemble-CNN-Architecture-10.png)
The paper "Detection of Distracted Driver using Convolutional Neural Network" describes using a CNN based system to detect distracted driver and to identify the cause of distraction [4]. VGG-16 architecture was modified for this particular task and several regularization techniques were applied to prevent over-fitting to the training data, thereby achieving a classification accuracy of 95.54% with the number of parameters reduced from 140M in original VGG-16 to 15M only. This study provides a peer reviewed benchmark to compare our model's performance against. The original paper's accuracy scores are:
TABLE 2: CLASS-WISE ACCURACY FROM THE "DETECTION OF DISTRACTED DRIVER USING CONVOLUTIONAL NEURAL NETWORK" PAPER [4]
| Class | Total Samples | Correct Predictions | Incorrect Predictions | Accuracy (%) |
|---|---|---|---|---|
| Safe Driving | 922 | 882 | 40 | 95.66 |
| Texting Using Left Hand | 326 | 316 | 10 | 96.93 |
| Talking on Phone Using Left Hand | 341 | 327 | 14 | 95.89 |
| Texting Using Right Hand | 494 | 473 | 21 | 95.75 |
| Talking on Phone Using Right Hand | 305 | 298 | 7 | 97.70 |
| Adjusting Radio | 403 | 399 | 4 | 99.00 |
| Drinking | 301 | 288 | 13 | 95.68 |
| Hair and Makeup | 301 | 288 | 13 | 95.68 |
| Reaching Behind | 290 | 273 | 17 | 94.14 |
| Talking to Passenger | 643 | 625 | 18 | 97.20 |
II. DATASETS AND IMAGE PRE-PROCESSING
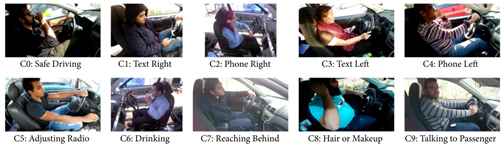
We started the study with the State Farm Distracted Driver Detection dataset obtained from Kaggle. The dataset consist of images grouped into the following 10 different classes:
- c0: safe driving
- c1: texting - right
- c2: talking on the phone - right
- c3: texting - left
- c4: talking on the phone - left
- c5: operating the radio
- c6: drinking
- c7: reaching behind
- c8: hair and makeup
- c9: talking to passenger
- c10: Eating
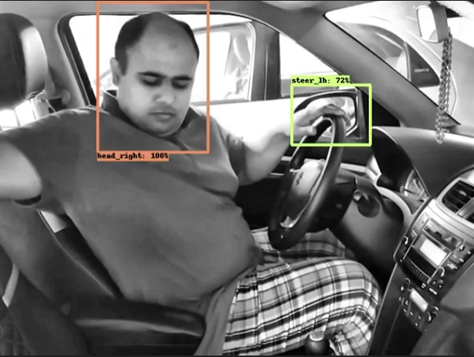
The above dataset was labelled by the authors with annotations (rectangular bounding boxes) using LabelImg tool. About 500 images from each category in the above dataset were segmented with the following labels:
- lh (left hand)
- rh (right hand)
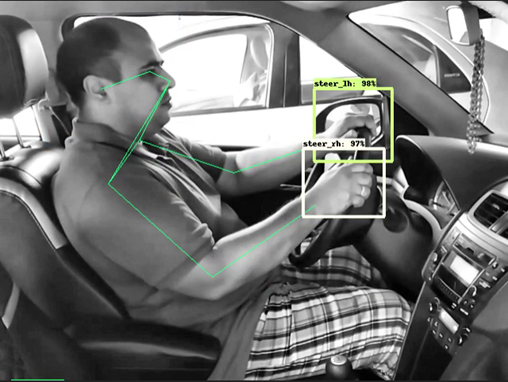
- steer_lh (left hand on steering wheel)
- steer_rh (right hand on steering wheel)
- phone
- phone_lh (phone in the left hand)
- phone_rh (phone in the right hand)
- cup
- cup_lh (cup in the left hand)
- cup_rh (cup in the right hand)
- head_front
- head_left
- head_right
- head_back
- head_down
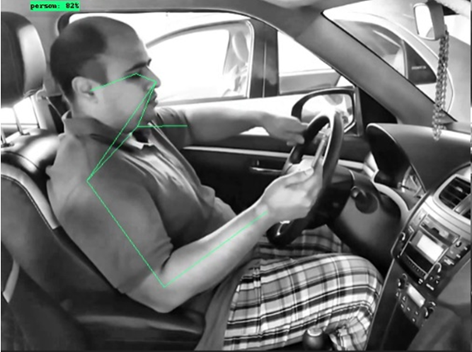
The following figures illustrate the original images against the labelled images.
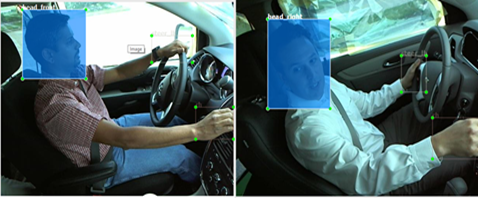
The Left hand image has the State farm dataset classification of c5: operating the radio. Our labels include 11: head_front as highlighted. The Right hand image has the State farm dataset classification of c9: talking to passenger. Our labels include 13: head_right as highlighted.
III. MATERIALS AND METHODS
A. Exploratory Data Analysis (EDA)
We have trained our solution models using the Kaggle State Farm Distracted Driver Detection dataset. Properties of the Kaggle dataset are:
| Field | Specification |
|---|---|
| Image Size in pixels | 480 X 640 |
| Training images count | 22424 (Compete dataset) 2000 (Custom labels) |
| Image Colour encoding | RGB |
The following were observed as the major sources of variance in the images:
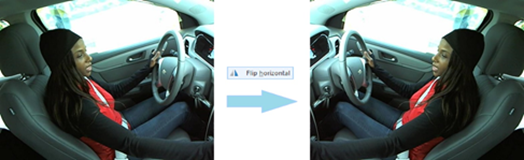
1) Left hand vs right handIn India, the steering wheel is on the right side of the car. Most of the image is the data set indicate the steering wheel on the left side of the car. The distortion can be corrected with a simple image flip as all images for training need to show the Indian standard.
The image set contains drivers of multiple ethnicities and genders. To generalize the model, the color of the drivers face, hair style, color and style of clothing and Head Gear following information in the image needs to be normalized. This information can be normalized using two techniques:
- Using a large dataset
- Using histogram normalization and comparing results of full colour images vs monochrome images
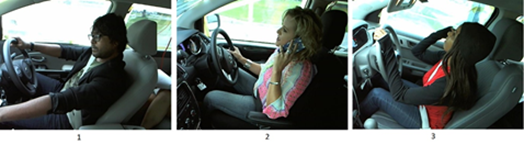
As we can see, besides the sitting pose and human body form, the drivers in images 1,2,3 above have no other properties in common. The driver Image 3 is also wearing a barely distinguishable head gear. All these properties need to be generalized by the model.
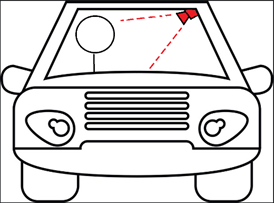
3) Image DistortionThe location of the camera and driver in the vehicle is not consistent. As such the relative location of fixed components in the images varies. Examples of fixed components include the steering wheel, transmission control, windows, mirrors, etc.
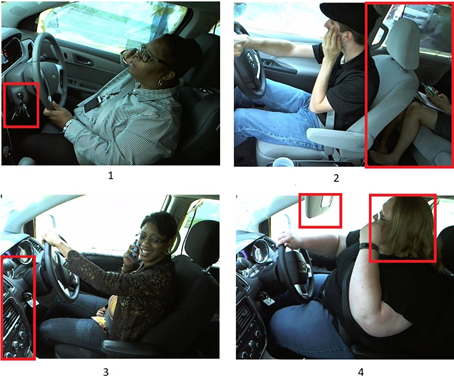
Image 1 – Set of keys is visible
Image 2 – The rear window and passenger is visible
Image 3 – The front dashboard is visible
Image 4 – The support beam is obstructed by the driver
All similar properties need to be generalized by the model which puts restrictions on the placement of the camera in the vehicle to ensure consistency.
Note – Experimentation has revealed that inconsistent camera placement is the highest distractor to model accuracy.
4) Image BackgroundSeveral images in the data set appear to be staged. The driver window is padded with a sheet to block out the background. This is not the true with field applications where the background is constantly changing.
Note – Experimentation study revealed that the model learns the background. Thus changing background can have a significant impact on model size.
5) Image SizeAll images in the data set are VGA - 640x480 pixels. Depending on the CNN model used, we might have to change the size to a 1:1 aspect ratio (e.g., 244x244 pixels)
The low image size impacts the models as there are less pixels that capture the objects of interest such as:
- Pixels for Human body parts such as Faces, hands, etc.
- Pixels for objects such as mobile phones, cups, steering wheel, etc.
NOTE – Implementation revealed that this does not have a significant impact on model accuracy
6) Image Color DistributionThe colour histograms of a random sample of images indicate a tendency to have saturated colours as they are skewed to the edges.
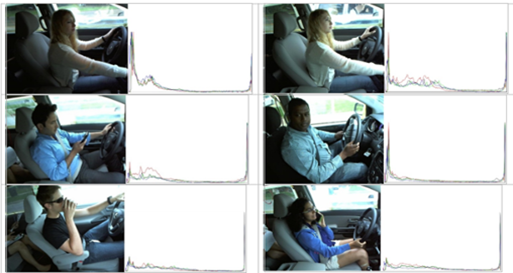
All images will need to be normalized before training the models:
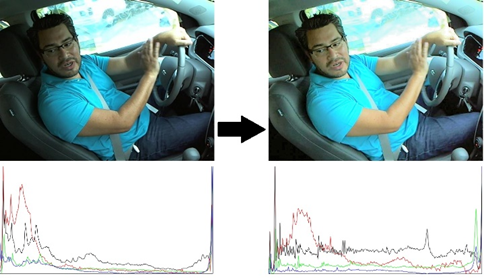
Normalization the images will spread the information across the spectrum, making the images gradients more visible for training. For better edge detection, we can apply various filters such as:
- Edge and Thresholding
- Histogram Equalization
- Contrast Limited Adaptive Histogram Equalization
Our solution used CLAHE because of the nature of the images. The images of a car cabin would have high contrasts because of bright outside light and dim interiors. Dimly lit images have digital noise. So while we want to get a better overall illumination, we do not want to increase the unnecessary noise. Hence CLAHE would be a better choice.
7) Time of DayAll training images are captured during daytime. So that solution can only operate in daytime. To make the solution weather independent, we need an Infrared spectrum Camera and illumination.
B. Methodology
Initial architecture and design were validated by Proof of Concept (POC). Based on the lessons learned from POC iterations, the architecture has been modified. The final solution architecture is shown below:

The solution architecture encompasses of three layers:
1) Input LayerThe objective of this layer is to take the images from different sources such as camera mounted on the dashboard of the vehicle etc.. The solution designed is also capable to process the image feed received from other sources such as stored video, database. The different building blocks of this layer are as below:
- Camera – process the feed from a USB or CSI camera. This is used for real time execution.
- Stored Video – process the feed from Local videos such as *.mp4 files. Used to evaluate on bench and get accuracy metrics
- Image Database – process the feed from Images stored in file system. Used to evaluate on bench and get accuracy metrics to compare against industry standards.
Image must be 3 dimensional. If converted to greyscale, the greyscale must be populated all three colour channels .The main operations performed here are:
- Get the image from the pipeline
- Apply filters such as CLAHE, Blurring, etc
- Flip image based on left / right hand drive
- Convert images to tensor for models and return the image tensor
- Return raw image of visualization
The image being read from the source can be of suboptimal quality because of factors such as ambient light, obstruction in the camera or blurriness because of a shaky camera or smudge on the camera lens. It is important that such images be prevented from being fed to the model because it would be a waste of the compute power.
In order to identify the exposure level of the image, Contrast Limited Adaptive Histogram Equalization (CLAHE) is applied to adjust the exposure levels. Even after applying CLAHE, if the mean of the pixel intensity values is going beyond the threshold values then the image is marked as under-exposed or over-exposed (as the case may be).
Camera obstruction can be considered as a sub-set of under-exposed image scenario. An obstructed camera would have most of the pixels on the darker side of the histogram which would make the image disqualified (under-exposed).
For examining the blurriness, a common method is using Fast Fourier Transform. It is a mathematical operation that changes the domain of a signal from time to frequency and is useful for decomposing a signal consisting of multiple pure frequencies.
The image is a spatial matrix of pixel values. These set of values are converted from the spatial domain of images to the frequency domain. In this method, we get to know the frequencies present in the image. Thus, if there is a low amount of high frequencies, the image is said to be blurry.
3) Key points DetectionFor key points detection, the Centernet HourGlass104 Key points 512x512 model was used. This model cannot be retrained based on Version-13 of the incremental builds. The output contains the following point detections: person, nose, left_eye, right_eye, left_ear, right_ear, left_shoulder, right_shoulder, left_elbow, right_elbow, left_wrist, right_wrist, left_hip, right_hip, left_knee, right_knee, left_ankle, right_ankle. This information can be overlayed on the image to get the following:
Retraining the ssd mobilenet v2 fpnlite 640x640 coco17 model for custom object gives image segmented into the custom classes shown above.
The presence or absence of custom objects was used to determine the distraction level.
5) IntegratorThe integrator overlays the images obtained from the following components:
- F2.2 – Is the camera blocked?
- F3.1 – Key points detection
- F3.2 – Image Class Diductor
Images from both models (Object detection + Centernet) are merged into one output. We overlay other information[19] such as image class and if lens is blocked. This gives us the final image.
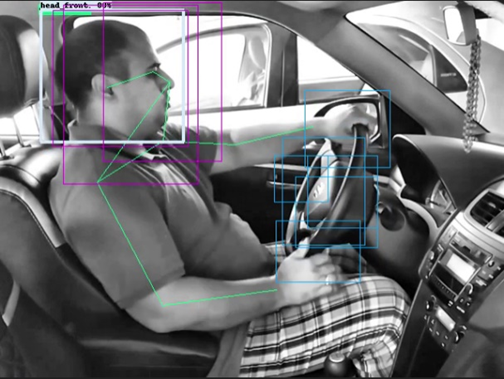
Certain applications require that the privacy of the user be protected. In this case we need to redact the users face. This is done by pixelating the box that contains any one of the 5 head detection classes.

We create a pixelated image of the original and apply a mask to keep only the head box. This masked image is then overlayed on the original so that we get only the head detection box pixelated out.
7) Image Class DetectorNot each frame of the image will have detections by the models. It is possible there might a series of frames with no detections. In this case, we retain the last detection with the following parameters:
- Image Detection class and detection boxes are retained.
- The age of each detection in "frames since last detection" is maintained.
The larger the age, the less accurate the prediction is. If we have trained our object detection models well, then this value should be as small as possible. The Head and Steer boxes are self-taught by the model. The basic idea is that:
- The model creates a list of all steer_lh and steer_rh detections
- Check if the current detections steer_lh and steer_rh of we have IOU lower than threshold[17] in the list of steering area boxes we have stored. If this is the first one, just store it and repeat this step
- If a detection has a lower IOU than the set threshold that all we have stored so far in the list, then it is added to the list
- The List size has a preset upper limit. If we have reached the maximum number of boxes allowed, stop this loop
The IOU and number of boxes are hyper parameters. This leads to an incremental buildup of areas that isolate the head and steer area:
An approach to determine the overall distraction has been taken in the solution. It is based on the combination of individual detections, e.g. head turned to left, phone or cup in hand, head turned behind etc. The DNN model's output values (detection classes, bounding box coordinates and confidence scores) are the inputs to the distraction level computing module. The module returns the overall distraction level and the amount of overlap (IoU) between head and the hands[18]. The corresponding overall distraction level for a combination of individual detection classes is stored in a dictionary.
These detection classes map to the distraction levels in the given combinations.
| Dictionary of detection classes | Dictionary of distraction levels |
|---|---|
|
detection_classes = { 1: 'lh', 2: 'rh', 3: 'steer_lh', 4: 'steer_rh', 5: 'phone', 6: 'phone_lh', 7: 'phone_rh', 8: 'cup', 9: 'cup_lh', 10: 'cup_rh', 11: 'head_front', 12: 'head_down', 13: 'head_left', 14: 'head_right', 15: 'head_back'} |
distraction_score_matrix = { '3,11': 0 '3,12': 2 '3,13': 2 '3,14': 2 '3,15': 5 '3,10,11': 2 '3,10,12': 4 '3,10,13': 3 '3,10,14': 3 '3,10,15': 7 '3,7,11': 6 '3,7,12': 8 '3,7,13': 6 '3,7,14': 6 '3,7,15': 10 '4,6,11': 6 '4,6,12': 8 '4,6,13': 6 '4,6,14': 6 '4,6,15': 10 '4,9,11': 2 '4,9,12': 4 '4,9,13': 3 '4,9,14': 3 '4,9,15': 7 '4,11': 0 '4,12': 2 '4,13': 2 '4,14': 2 '4,15': 5 } |
The keys correspond to the combination of individual distraction classes. The values are the overall distraction score awarded by the module.
This retains is flexible and scalable. It can be used to cover more detection classes and adjusting the corresponding distraction score.
A secondary approach oonce we have the head and steer areas defined is to implement custom procedural logic to determine the classes of the output using the following legend and logic:
- ol_head - Check if the left or right wrist (from centernet model) overlap with the head area
- ol_steer - Check if the left or right wrist (from centernet model) overlap with the steering wheel area
- rw_behind - Check if the right wrist (from centernet model) is BEHIND and BELOW the steering area, where the dash board is
- rw_absent - Check if the right wrist (from centernet model) is absent from the image
| lh | rh | S | ol_head | ol_steer | rw_behind | rw_absent | |||||
|---|---|---|---|---|---|---|---|---|---|---|---|
| c0 | steer_lh | OR | steer_rh | AND | head_front | AND | FALSE | AND | TRUE | ||
| c1 | phone_rh | AND | FALSE | ||||||||
| c2 | phone_rh | AND | TRUE | ||||||||
| c3 | phone_lh | AND | FALSE | ||||||||
| c4 | phone_lh | AND | TRUE | ||||||||
| c5 | TRUE | ||||||||||
| c6 | cup_lh | OR | cup_rh | ||||||||
| c7 | head_right head_back |
AND | TRUE | ||||||||
| c8 | lh steer_lh |
OR | rh steer_rh |
AND | TRUE | ||||||
| c9 | lh steer_lh |
OR | rh steer_rh |
AND | head_right |
The purpose of this layer is to output the result and capture logs. The different building blocks of this layer are as below:
- Composite Video Out - Displays the final video having bounding boxes on hands, face and steering wheel (all with labels) and the final distraction level (low, medium or high) for each successive frame.
- Log File - Logs the following data in a csv file for each image being predicted from the test video:
- Timestamp
- Time Difference between two images
- Image Class (between c0 to c9)
- Distraction Level (1 to 10)
C. Implications
- Higher model accuracy can be obtained using a consistent location in the car. It is ideal if the training images are of the same car that is being targeted for production.
- Image pre-processing can be integrated into the camera physics. If we use a Infra-red spectrum camera with Infra-red illumination, then the image will be environmentally agnostic and monochrome. This will reduce the computational overhead of pre-processing the images.
- Using an Object detection model is not recommended in future iterations. Using an image segmentation model that relies on the know location of the camera and vehicle interior can easily sperate out the driver. We can then run a model on the filtered image to extract driver features that can be run thought a simple classification ML model that will predict the class
IV. ASSUMPTIONS AND LIMITATIONS
Assumptions made while developing the model and the scope for improvement as below:
- The model may not detect driver distractions at night time because the dataset used are captured at daylight. Also, different approach is required for the handling of images captured in low-light or no-light.
- The dataset is of pre-pandemic era, we don't have images of drivers with masks which can lead to low generalization of the model for current drivers.
- The model is dependent on the camera position and make of the car and dashboard.
- Optionally, the model may retrain itself for high confidence images captured during operation using the following flow.
V. DISCUSSIONS AND CONCLUSIONS
Driver distraction detection solutions are possible to implement with the following features using today's commercially available tools and techniques:
- Embeddable solutions using low power and small form factor devices such as the Jetson Nano.
- Driver segmentation, detection and classification using open-source (but not freely licensable) tools such as Tensorflow Model-garden.
Model accuracy is highly dependent on:
- Consistent location of the camera in the automobile
- Using a training set obtained in the target automobile
- Type of Camera used for image capture.
- More data. A LOT more data.
In conclusion, it is possible to move the computation overhead of the Driver detection from the DNN-Object Detection models to the physical parameters of the system components (e.g. Car make, camera position, etc) and simple math such as subtracting the vehicle body form the image.
This can allow for having a VERY small footprint solution for the Driver Detection and Distraction monitoring for commercial applications.
REFERENCES
- Wilson, F. A., & Stimpson, J. P. (2010). Trends in fatalities from distracted driving in the United States, 1999 to 2008. American Journal of Public Health, 100(11), 2213–2219.
- Smirnov, A., & Lashkov, I. (n.d.). State-of-the-art analysis of available advanced driver assistance systems. from E-werest.org website: https://ewerest.org/sites/default/files/files/conference17/AdvancedDriverAssistance.pdf
- N. Darapaneni, B. Krishnamurthy, and A. R. Paduri, "Convolution Neural Networks: A Comparative Study for Image Classification," in 2020 IEEE 15th International Conference on Industrial and Information Systems (ICIIS), 2020, pp. 327–332.
- Image Processing. (n.d.). Detection of distracted driver using convolutional neural network. Retrieved July 9, 2021, from Thecvf.com website: https://openaccess.thecvf.com/content_cvpr_2018_workshops/papers/w14/Baheti_Detection_of_Distracted_CVPR_2018_paper.pdf
- Gjoreski, M., Gams, M. Z., Lustrek, M., Genc, P., Garbas, J.-U., & Hassan, T. (2020). Machine learning and end-to-end deep learning for monitoring driver distractions from physiological and visual signals. IEEE Access: Practical Innovations, Open Solutions, 8, 70590–70603.
- Oberoi, M., Panchal, H., & Jain, Y. (2013). Driver Distraction Detection using Transfer Learning. Retrieved July 9, 2021, from Ijert.org website: https://www.ijert.org/research/driver-distractiondetection-using-transfer-learning-IJERTV9IS050862.pdf
- N. Darapaneni et al., "Automatic face detection and recognition for attendance maintenance," in 2020 IEEE 15th International Conference on Industrial and Information Systems (ICIIS), 2020, pp. 236–241
- (N.d.). Retrieved July 9, 2021, from Researchgate.net website: https://www.researchgate.net/profile/Ha-Do-10/publication/326740203_Realtime_Detection_of_Distracted_Driving_based_on_Deep_Learning/links/5ba96a41a6fdccd3cb70a927/Real-time-Detection-of-Distracted-Driving-based-on-Deep-Learning.pdf
- Jiménez Moreno, R., Avilés Sánchez, O., & Amaya Hurtado, D. (2014). Driver distraction detection using machine vision techniques. Ingeniería y Competitividad, 16(2), 55–63.
- Eraqi, H. M., Abouelnaga, Y., Saad, M. H., & Moustafa, M. N. (2019). Driver distraction identification with an ensemble of convolutional neural networks. Journal of Advanced Transportation, 2019, 1–12.
- N. Darapaneni, R. Choubey, P. Salvi, A. Pathak, S. Suryavanshi, and A. R. Paduri, "Facial expression recognition and recommendations using deep neural network with transfer learning," in 2020 11th IEEE Annual Ubiquitous Computing, Electronics & Mobile Communication Conference (UEMCON), 2020, pp. 0668–0673.
- Gjoreski, M., Gams, M. Z., Lustrek, M., Genc, P., Garbas, J.-U., & Hassan, T. (2020). Machine learning and end-to-end deep learning for monitoring driver distractions from physiological and visual signals. IEEE Access: Practical Innovations, Open Solutions, 8, 70590–70603.
- Jain, D. K., Jain, R., Lan, X., Upadhyay, Y., & Thareja, A. (2021). Driver distraction detection using capsule network. Neural Computing & Applications, 33(11), 6183–6196.
- Kim, W., Jung, W.-S., & Choi, H. K. (2019). Lightweight driver monitoring system based on multi-Task Mobilenets. Sensors (Basel, Switzerland), 19(14), 3200.
- Mofid, N., Bayrooti, J., & Ravi, S. (2020). Keep your AI-es on the road: Tackling distracted driver detection with convolutional neural networks and targeted data augmentation. Retrieved from http://arxiv.org/abs/2006.10955
- Alkinani, M. H., Khan, W. Z., & Arshad, Q. (2020). Detecting human driver inattentive and aggressive driving behavior using deep learning: Recent advances, requirements and open challenges. IEEE Access: Practical Innovations, Open Solutions, 8, 105008–105030.
- N. Darapaneni et al., "Activity & emotion detection of recognized kids in CCTV video for day care using SlowFast & CNN," in 2021 IEEE World AI IoT Congress (AIIoT), 2021, pp. 0268–0274.
- N. Darapaneni et al., "Computer vision based license plate detection for automated vehicle parking management system," in 2020 11th IEEE Annual Ubiquitous Computing, Electronics & Mobile Communication Conference (UEMCON), 2020, pp. 0800–0805.
- N. Darapaneni et al., "Autonomous car driving using deep learning," in 2021 2nd International Conference on Secure Cyber Computing and Communications (ICSCCC), 2021, pp. 29–33.