Learn to turn numbers into insights and insights into smarter decisions. Master Excel, SQL, Python, Power BI, and statistics to analyse real-world data, spot trends, and build compelling dashboards and reports. Go from learning the fundamentals to applying your skills in practice, and build the confidence to step into a career as a Data Analyst.
$99$15034% off
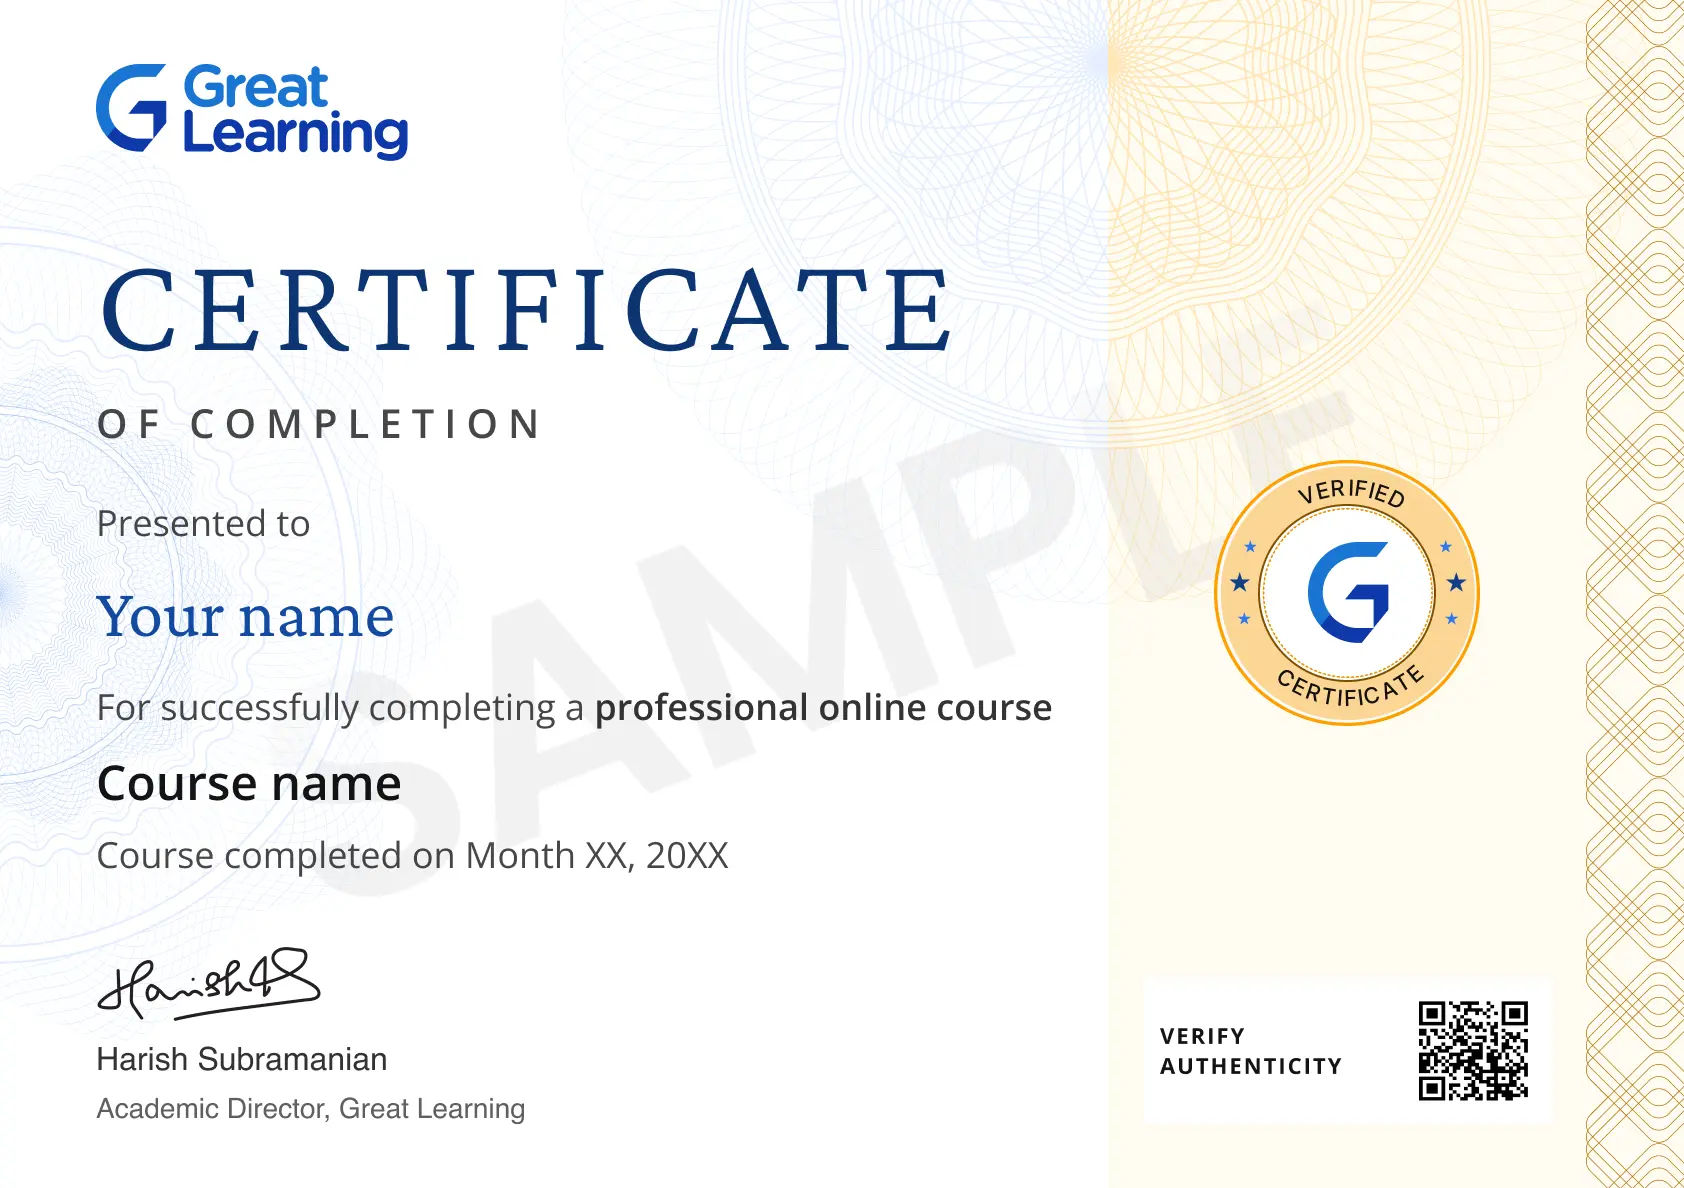
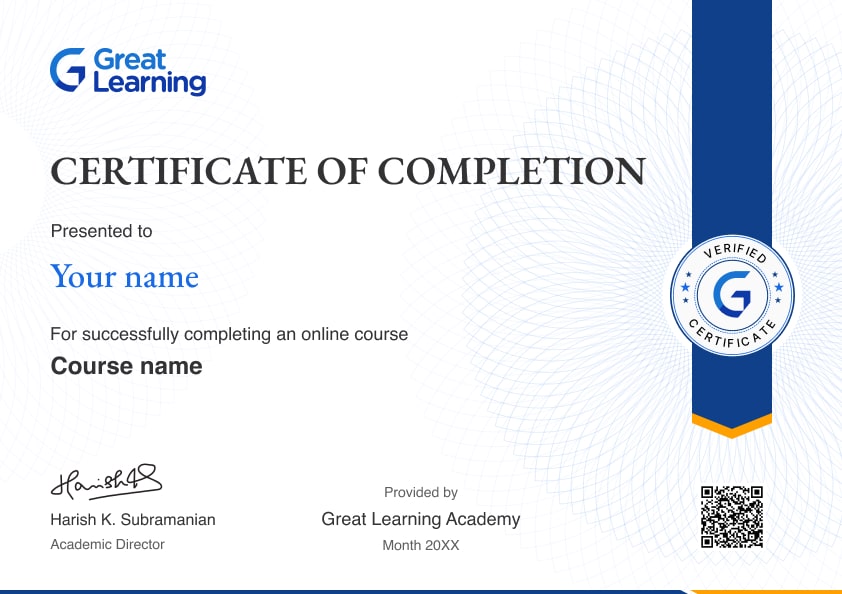
Get career certificate + course certificates
Skills you will gain
Excel
Data Analysis
SQL
Exploratory Data Analysis
Statistical Analysis
Tools you will learn
Excel
NumPy
Pandas
Power BI
SQL
Earn a career certificate that showcases your complete skill set
$99$15034% off
Stand out to recruiters
Shown on professional channels
Globally recognised
Awarded on completing the series
Data Analyst Career Certificate (6 course series)
6 courses · 4 weeks
Learn to turn numbers into insights and insights into smarter decisions. Master Excel, SQL, Python, Power BI, and statistics to analyse real-world data, spot trends, and build compelling dashboards and reports. Go from learning the fundamentals to applying your skills in practice, and build the confidence to step into a career as a Data Analyst.
Earn a career certificate
Get recognised for your skills with a certificate and share it on LinkedIn.
Learn data modeling, basic & advanced visualizations, creating advanced charts, and working with parameters. Join this Power BI Data Visualization course to build dynamic dashboards that turn data into powerful visual insights.
Skills you will gain
Data Structure and Visual AnalyticsBasic Charts and Visualization ConceptsData Handling & CalculationsAdvanced Chart TypesWorking with ParametersDashboarding in Power BIAdvanced Data HandlingStorytelling with Power BI
+2 More
Add a certificate to your resume
Share your certificate on LinkedIn and stand out to recruiters.
Learn how to uncover hidden insights and patterns in data through hands-on exercises and real-world examples. Enroll now and start your journey towards becoming a data analysis pro!
Skills you will gain
Exploratory data analysissummary statisticsdata cleaningvisualization (histogramsboxplotsscatter)handling missing values
+1 More
Add a certificate to your resume
Share your certificate on LinkedIn and stand out to recruiters.
Learn data analysis, machine learning, and data visualization with Python, probability distributions, EDA, ML algorithms, and model evaluation. Join our Python Data Science course and build practical data-driven innovations.
Skills you will gain
Python - NumPyPandasProbability and DistributionsDescriptive StatisticsExploratory Data Analysis (EDA)Supervised Learning - Linear RegressionSupervised Learning - Logistic RegressionDecision TreesEnsemble TechniquesUnsupervised Learning
+4 More
Add a certificate to your resume
Share your certificate on LinkedIn and stand out to recruiters.
Learn probability, descriptive statistics, and statistical inference techniques to analyze data. Join this statistics course for data science to gain data visualization and hypothesis testing skills for data-driven insights.
Skills you will gain
StatisticsProbabilityMeanMedianStandard Deviation
Add a certificate to your resume
Share your certificate on LinkedIn and stand out to recruiters.
Unlock the power of SQL with this data analytics course! Dive into database essentials, explore advanced SQL techniques, and gain hands-on experience by solving real world problems.
Learn essential Excel techniques like cell referencing, data cleaning, conditional formatting, text manipulation and dynamic chart creation. Join this advanced Excel course to sharpen your data analysis and decision-making skills.
Skills you will gain
Data VisualizationPivot TablesConditional FormattingData CleaningCell ReferencingIf-Else Logic Budgeting TechniquesBusiness IntelligenceChatGPT in Excel
+2 More
Add a certificate to your resume
Share your certificate on LinkedIn and stand out to recruiters.
$99$15034% off
Earn a career certificate
Get recognised for your skills with a certificate and share it on LinkedIn.
This course taught me A to Z of Power BI, and it gave me confidence in handling data like never before and showing a positive graph in managing my huge data at the office. The content is good and covers most of the Power BI elements. The explanation of the content is really good and presented in a simple method.
Effective learning strategies for engagement and retention
Effective learning can be enhanced through active learning, which involves hands-on activities, discussions, and problem-solving to deepen understanding. Personalization allows learners to progress at their own pace, while continuous feedback keeps them motivated. Real-world applications and collaborative learning boost engagement. Emotional support, technology integration, and retrieval practice strengthen memory. Finally, teaching metacognition empowers learners to regulate their learning process for greater success.
Great Learning offers various courses that cover Exploratory Data Analysis (EDA) as part of their data science and analytics programs. Here’s an overview of what you might find:
Great Learning EDA Course Highlights
Comprehensive Curriculum:
Foundations of Data Science: Introduction to basic concepts in data analysis.
EDA Techniques: Detailed coverage of techniques for data exploration, visualization, and interpretation.
I recently completed the course, and overall, I found it to be quite informative and well-structured. The content was relevant and covered a wide range of topics that provided me with a solid understanding of the subject matter.
This is a great course and very helpful for beginners. I work with Power BI and frequently connect SQL to Power BI, which was covered in this course. Learning these concepts was extremely practical and valuable for my day-to-day work.
This course enhanced my ability to analyze data effectively and present insights through professional Power BI visualizations.
The Advanced Data Visualization using Power BI course was highly informative and practical. It helped me develop skills in creating interactive dashboards, analyzing data, and presenting insights effectively. The hands-on exercises enhanced my understanding of Power BI tools and real-world applications. Overall, it was a valuable learning experience that strengthened my data analytics and visualization capabilities.

 Career Certificate