Have you ever wondered how a slight change in your budget, sales numbers, or interest rate might affect your final results? That’s precisely where What-If Analysis in Excel comes in.
Whether you're planning a budget, forecasting sales, or making business decisions, What-If Analysis helps you explore different possibilities before committing to one.
In this tutorial, we’ll walk through what defines What-If Analysis, and show you exactly which tools are used to perform What-If Analysis in Excel.
Learn Excel for powerful data analysis and enhance your skills for better decision-making.
What is What-If Analysis in Excel?
Essentially, it gives you the opportunity to explore new possibilities by examining your data. It makes exploring what happens if you change different values in your spreadsheet simple. Simply put, you’re trying out what-ifs, keeping your actual data intact.
Think of What-If Analysis as a way to forecast different outcomes. Instead of guessing, Excel gives you answers based on real formulas and inputs. It’s especially helpful when planning for uncertain situations, like estimating profits under different sales volumes or adjusting costs in a project.
What-If Analysis can be done in Excel with three built-in tools:
- Scenario Manager: You can set up different scenarios and look at what happens under each one.
- Goal Seek: If you set a target outcome, Goal Seek helps provide the input needed to reach that result.
- Data Tables: Great for testing multiple values at once, you can see how adjusting a couple of variables affects your total.
Every tool is unique, and using their powers together gives What-If Analysis the flexibility and strength it has.
Getting Started: Preparing Your Data
A well-structured and neat spreadsheet is crucial for any type of analysis. Initially, you should double-check your calculations, how references to cells are used, and that the layout is clear.
For setting up a clean, structured spreadsheet, this Excel training course covers everything from foundational basics to advanced Excel functions, helping you build the skills needed for effective data analysis.
To understand more better, take Data Analysis Quiz.
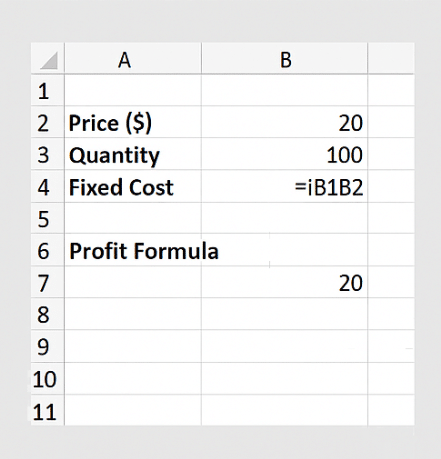
If your task is to make a sales forecast, here are some points to remember. You may design a standard sheet that demands basic information such as unit price, items sold, fixed costs, and variable costs. Then, using a formula, you calculate total revenue and profit.
This kind of setup makes it easy to use What-If Analysis in Excel later on. For example, you can test what happens to profit if sales go up, or if you reduce production costs. With your data structured correctly, the tools: Scenario Manager, Goal Seek, and Data Tables, can do the heavy lifting.
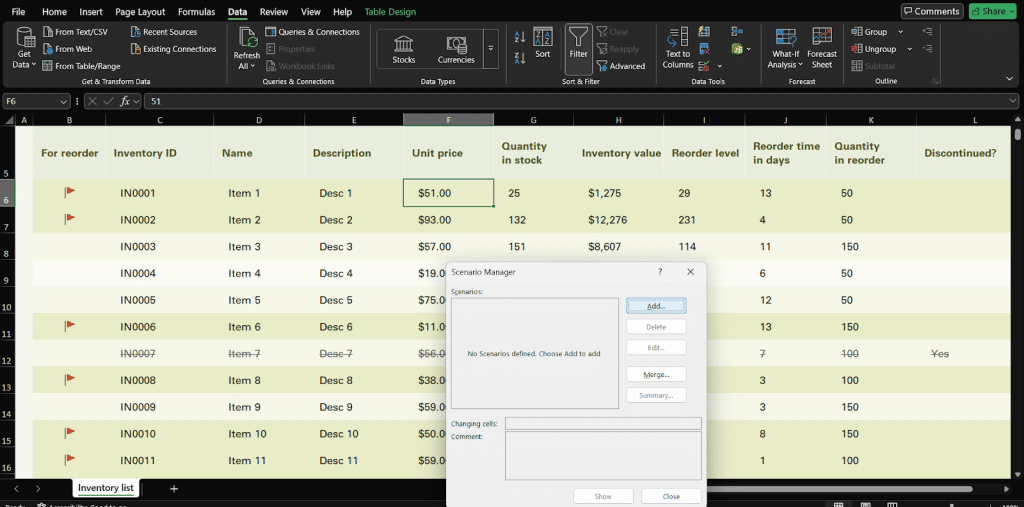
Using Scenario Manager
The Scenario Manager is one of the most powerful tools for What-If Analysis in Excel. It lets you create different input value scenarios to compare various outcomes. This is great for planning or evaluating best- and worst-case situations.
Scenario Manager pairs well with lesser-known Excel features.
Here’s how to use Scenario Manager:
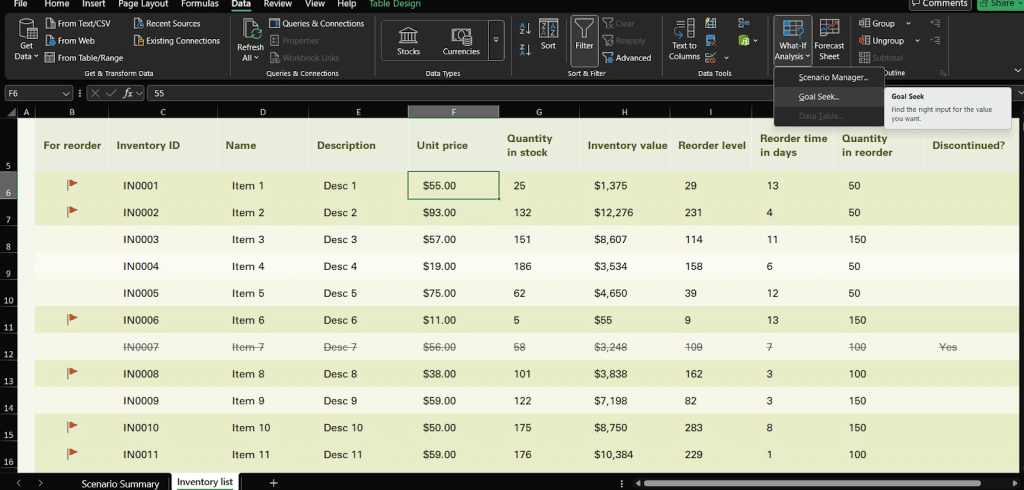
- Go to the “Data” tab on the Excel ribbon.
- Click “What-If Analysis”, then select “Scenario Manager.”
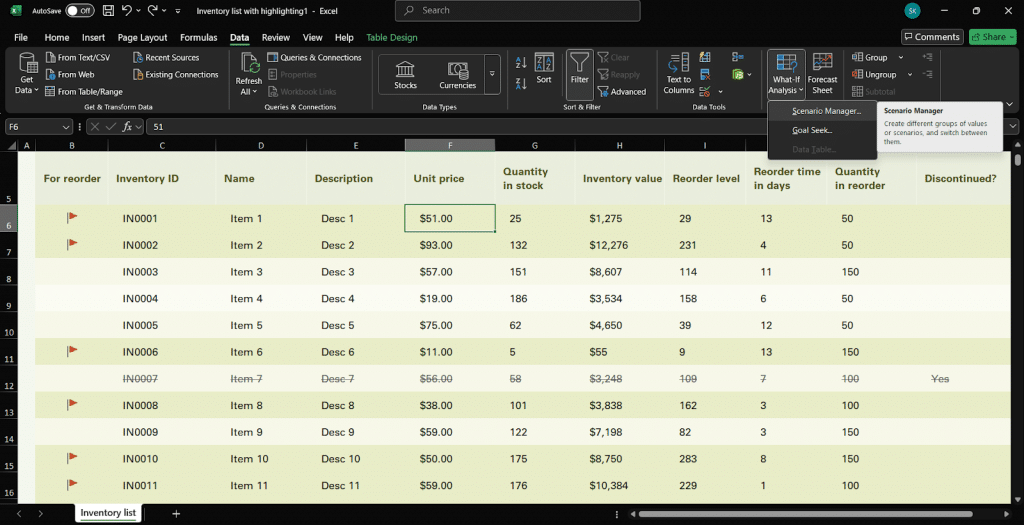
- In the dialog box, click “Add” to create your first scenario maybe increase in price that projects change in inventory value.
- Choose the input cells (for example: unit price), and enter the values for this scenario.
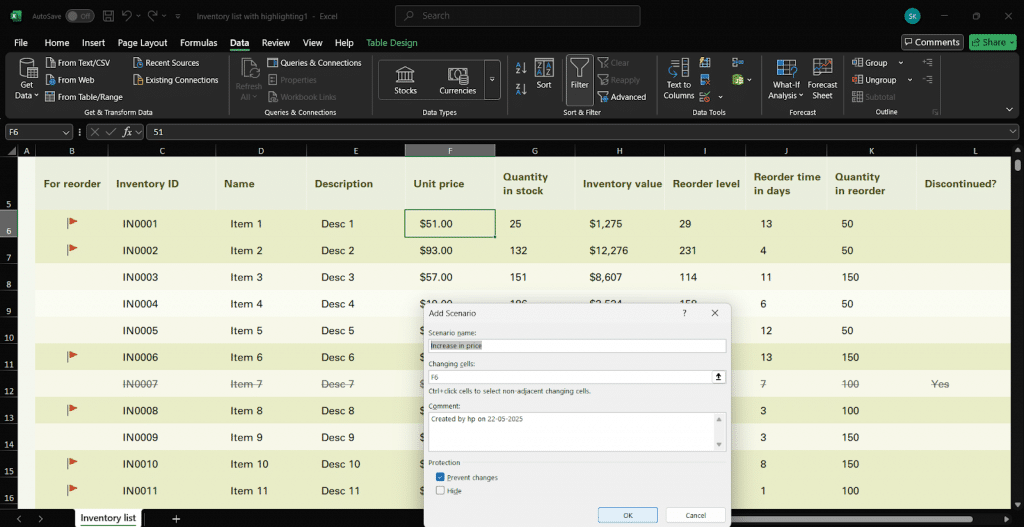
- Repeat the process for additional scenarios, like a decrease in price that projects change in inventory value.
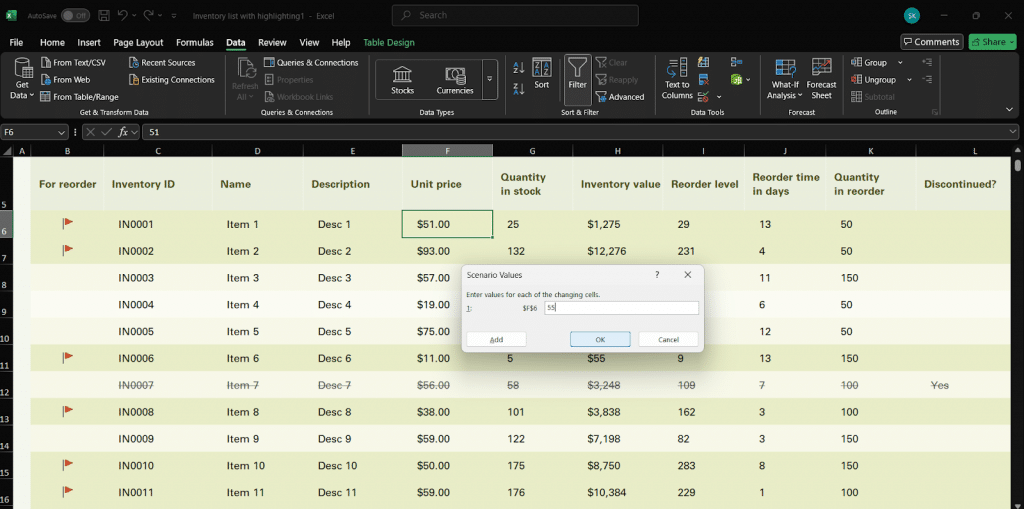
- Once your scenarios are added, click “Show” to view each one or use “Summary” to generate a comparison table.
This tool is ideal when you need to review what might change if the company’s strategy or the market changes. A simple action allows you to change your outlook from optimistic to pessimistic without repeating any calculations.
Using Scenario Manager allows you to contrast several outcomes, so you can pick the best strategy for your company. It’s a perfect entry point into mastering What-If Analysis in Excel.
Using Goal Seek
Another popular tool used to perform What-If Analysis in Excel is Goal Seek. It’s simple, fast, and incredibly useful when you know the result you want but need Excel’s help to figure out the input that gets you there.
Here’s how Goal Seek works:
- Go to the “Data” tab, click “What-If Analysis,” and select “Goal Seek.”
- In the pop-up box:
- Set the “Set cell” to the formula cell (e.g., inventory value).
- Set the “To value” to your goal (e.g., $2,000).
- Set the “By changing cell” to the input you want to tweak (e.g., unit price).
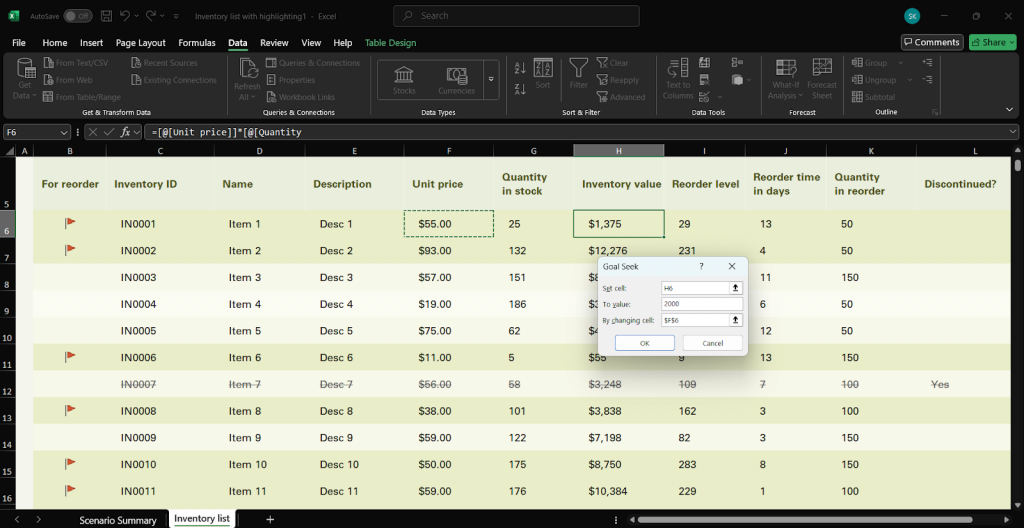
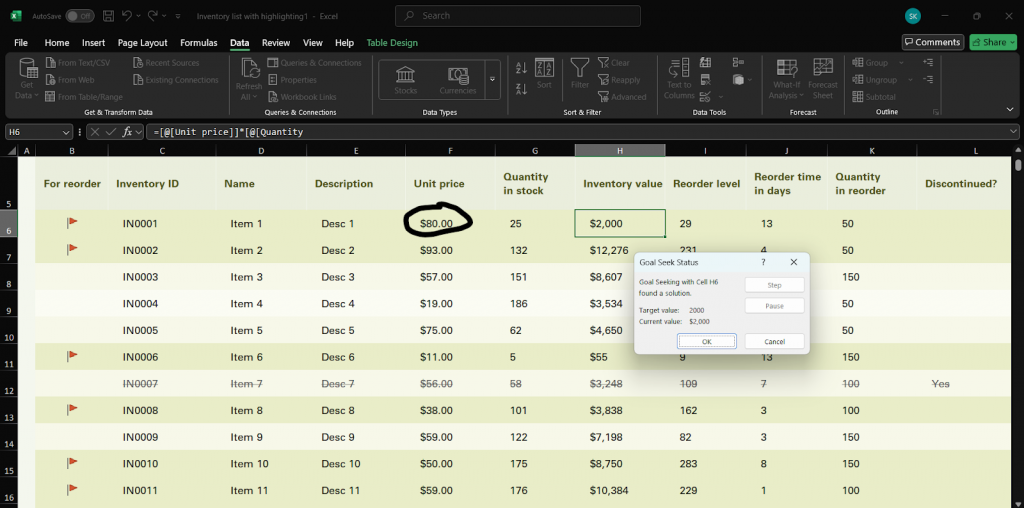
- Excel will calculate exactly what unit price you need to reach your goal - $2000 worth inventory value.
Example: Let’s say your spreadsheet calculates profit based on units sold. You want to know how many units you need to sell to earn $10,000. With Goal Seek, Excel will tell you the answer in seconds, and no manual trial-and-error is required.
Goal Seek is perfect for simple “reverse-engineering” tasks and fits seamlessly into any What-If Excel workflow.
Using Data Tables
When you want to see how changing one or two variables affects your results, Data Tables are the go-to tool in What-If Analysis in Excel. They're ideal for quickly comparing many outcomes without rewriting formulas or creating new scenarios.
Types of Data Tables:
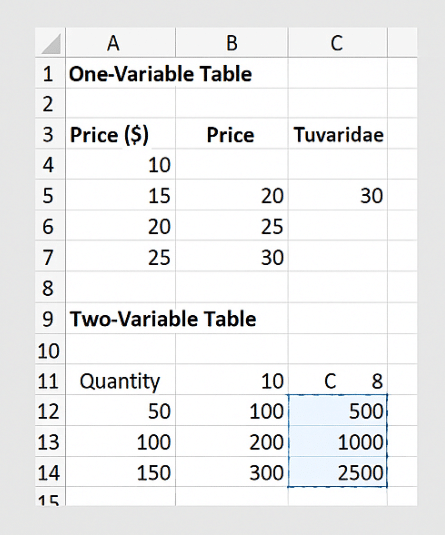
- One-variable Data Table: Analyzes how changing a single input affects a result.
- Two-variable Data Table: Examines how two inputs change one outcome.
Here’s how to set up a Data Table:
- Set up your formula, for example, profit based on price and quantity.
- Arrange your input values:
- For a one-variable table, list input values vertically in one column.
- For a two-variable table, list one set of values down a column and the other across a row.
- Select the full range (inputs + formula cell).
- Go to the “Data” tab > “What-If Analysis” > “Data Table.”
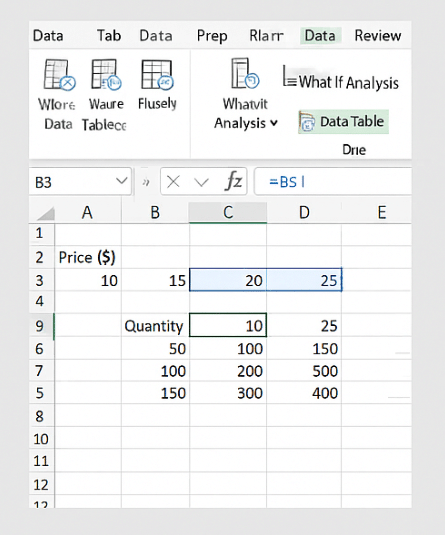
- In the dialog box:
- Enter the Row input cell (if applicable).
- Enter the Column input cell.
- Click OK, and watch Excel instantly fill in your results.
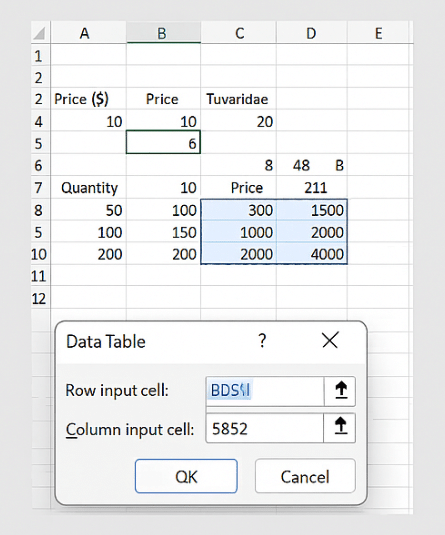
Example: Imagine testing how different interest rates affect a loan payment, or how various combinations of price and quantity affect revenue.
With just a few clicks, Data Tables help you explore multiple outcomes side by side, saving time and improving your decision-making with minimal effort.
Real-Life Example or Use Case
Let’s say you’re planning next quarter’s product launch and want to estimate profit under different pricing strategies and sales volumes.
You start by using Scenario Manager to model best-case, average, and worst-case projections.
Then, you apply Goal Seek to figure out how many units you need to sell to meet a profit target.
Finally, you use a two-variable Data Table to test how changes in both price and volume affect your bottom line.
To take your analysis further, combining Excel with SQL can enhance your ability to handle real business data. Check out this Data Analytics in SQL & Excel Course to elevate your analytics skills.
Excel’s What-If Analysis helps show how you can mix various techniques to make well-informed decisions based on data.
Having these tools handy can allow you, in finance, marketing, or project management, to understand outcomes, set appropriate goals, and decide your next action.
Tips & Best Practices
To get the most out of What-If Analysis in Excel, a little structure goes a long way.
Start by keeping your formulas consistent. Avoid mixing different logic or cell references in your calculations. Consistency makes your scenarios and data tables much easier to manage and interpret.
Always label your scenarios clearly. Use names like “Best Case,” “Base Case,” or “Q4 Forecast” so you know exactly what each one represents, especially when sharing your file with others.
Lastly, make sure to use cell references instead of hard-coded numbers in your formulas. This allows Excel to update your outputs dynamically when inputs change, essential for tools like Goal Seek and Data Tables.
Following these best practices helps you create clean, flexible models that make your What-If Analysis more powerful and reliable.
Conclusion
In this tutorial, we explored What-If Analysis in Excel using tools like Scenario Manager, Goal Seek, and Data Tables. You’ve learned how to test different scenarios, set goals, and evaluate multiple outcomes with ease.
The best way to get comfortable is to practice with real datasets, try out different tools, and see how they work together. And while Excel tools like Scenario Manager and Data Tables are excellent for early-stage planning, professionals often upgrade to more advanced data techniques like predictive modeling or optimization in business analytics or data science roles.
Whether you’re analyzing budgets, forecasts, or business decisions, What-If Analysis is a powerful Excel capability. To get the most out of these tools—especially if you’re new to spreadsheets starting with a Free Excel course can help you learn the basics and progress smoothly toward advanced Excel analysis techniques.