
Tableau Free Course
Data Visualisation in Tableau
 4.6
Beginner level
3.0 learning hrs
Learn the basics of Tableau in this free Tableau course and get started with Data Analytics. You will learn about different Tableau tools/charts, and how to visualise maps, segmentations, dashboards and scatter plots using filters
Instructor:
Mr. R Vivekanand


What you'll learn


About this course
Data Visualization is an important skill set of a data scientist, data analyst or a business analyst. You might be able to understand the final technical result but it would be hard for a non-technical person to understand the same. Hence, it’s always a good idea to show our results in the form of beautiful visualizations or dashboards. Tableau is currently one of the best tools in the market for this purpose. In this course, we shall properly learn all the fundamentals of Tableau.
Course outline
What is Business Intelligence?
Business Intelligence is a process of using raw data to get valuable business insights. This module introduces you to Business Intelligence and helps you understand its effects on your business, and you will also learn about its various features.
What is Data Visualization?
Data visualization is the process of creating visual representations of data to gain insights and understanding, and this module aims at introducing it to learners. You will also learn about its importance and use in business.
What is Tableau?
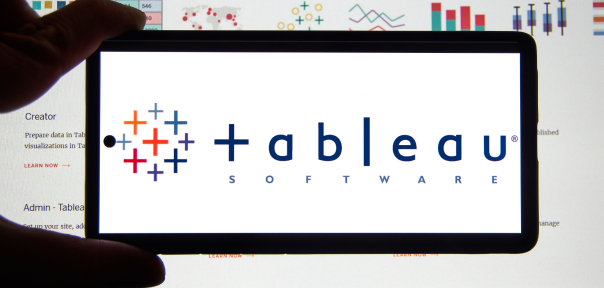
Tableau is a software program that authorizes users to create visual representations of data. This module introduces you to Tableau and explains its features along with its architecture.
Tableau Product Family
This module focuses on the standard products Tableau provides, and you will get a brief overview of these products.
Tableau Data Types
Data types are the types associated with variables that hold data. This module aims to introduce you to the data types available in Tableau.
Tableau Interface
This module contains a demo that familiarizes you with the Tableau interface. You will also know to connect Tableau with data sources or import data.
Tableau Dashboard
This module familiarizes you with the Tableau Dashboard, and you will learn about reports and visuals in Tableau.
Demo - Visual Analytics
This module contains a demo of visual analytics of Tableau. You will learn about visualizing various charts like a bar chart, line chart, histogram, and pie chart through Tableau.
Demo - Dashboards
You are already introduced to the Tableau dashboard in one of the previous modules. This module will give you better clarity through the demo on creating a dashboard in Tableau.
Data Visualization Tools
Nowadays, businesses are more into business intelligence and data visualization, dragging data visualization tools into the picture. This module focuses on the most popular data visualization tools like Tableau, Power BI, and Excel.
Tableau Installation
In order to work with Tableau, you must first have it on your system. Thus, this module gives you the information on installing Tableau on your system.
Get access to the complete curriculum once you enroll in the course
 4.6
Level up with advanced skills & become job ready with Pro+
Subscribe to Pro+ today to build skills with 50+ Pro courses and prep for jobs with advanced AI tools.
 PRO

Practice exercises
Guided Projects
AI Resume Builder
AI mock interviews






What our learners enjoyed the most
Skill & tools
60% of learners found all the desired skills & tools
Our course instructor

Mr. R Vivekanand
Co-Founder and Director
Data Science Expert


Frequently Asked Questions
Will I get a certificate after completing this free Data Visualisation in Tableau course?
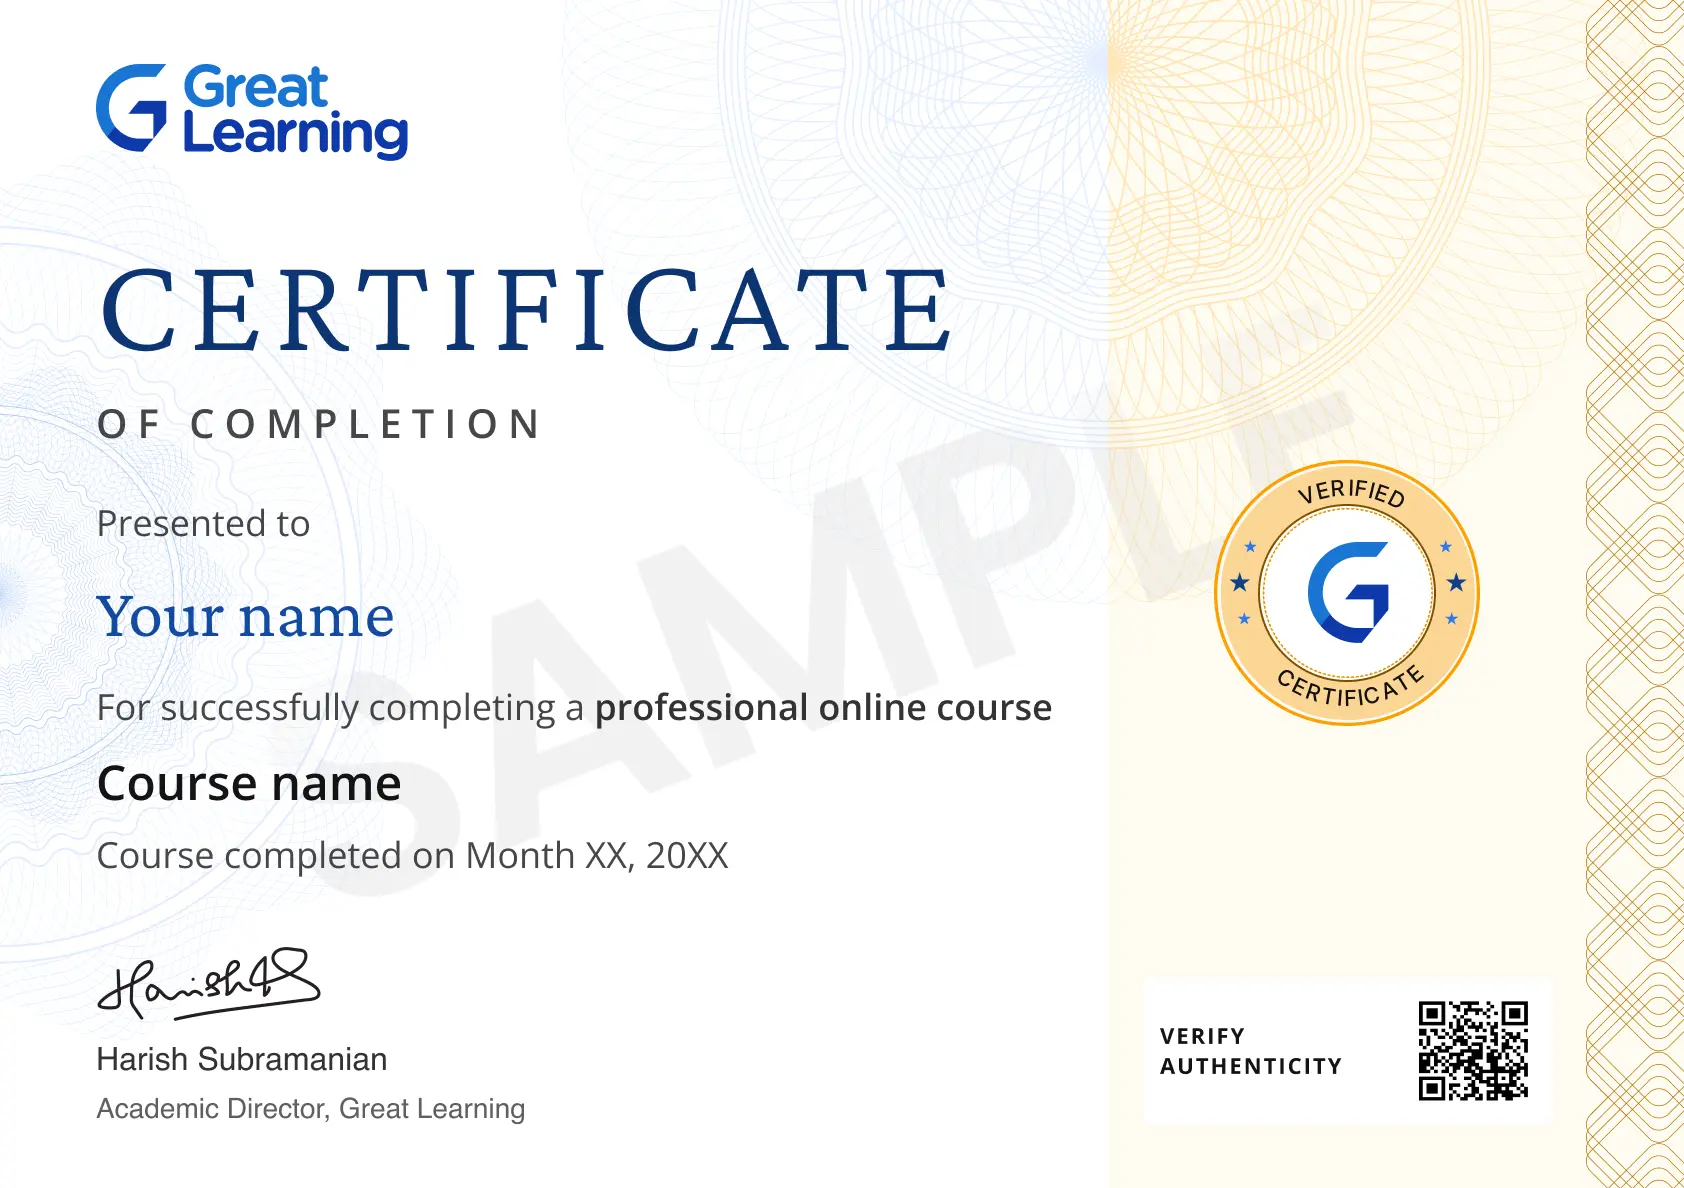
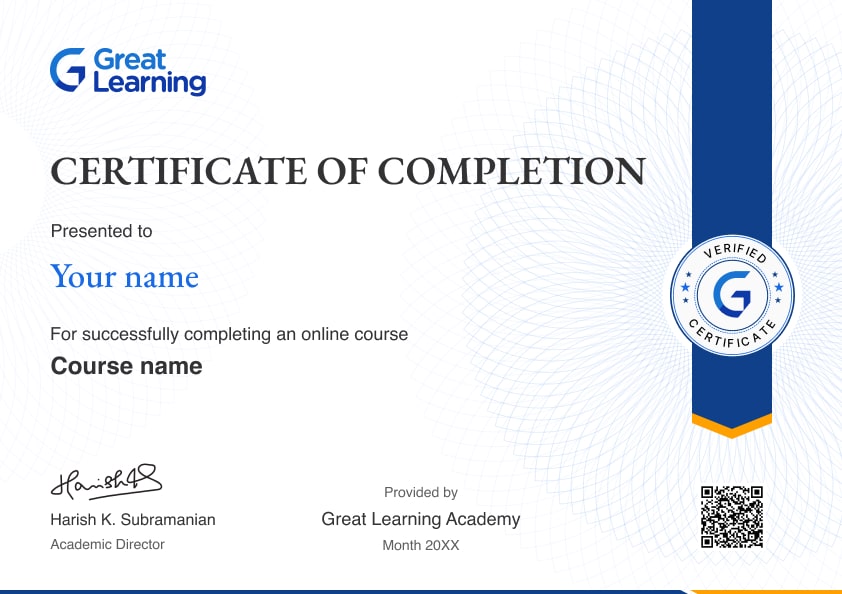
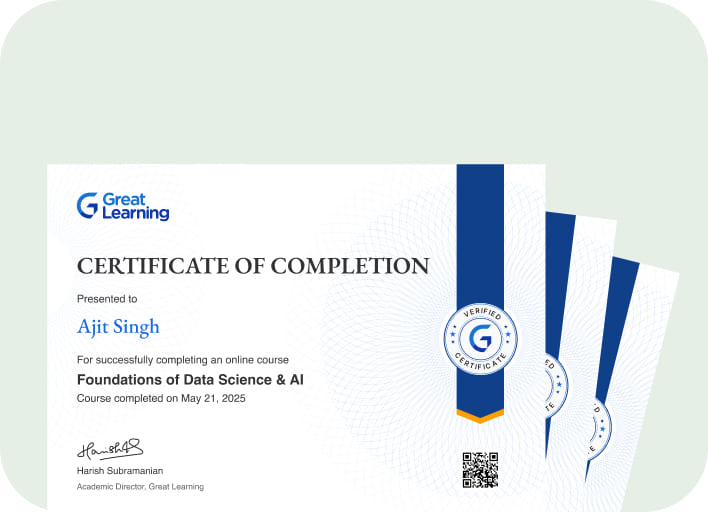
Yes, you will get a certificate of completion for Data Visualisation in Tableau course after completing all the modules and cracking the assessment. The assessment tests your knowledge of the subject and badges your skills.
How much does this Data Visualisation in Tableau course cost?
It is an entirely free course from Great Learning Academy. Anyone interested in learning the basics of Tableau Data Visualisation can get started with this course.
Is there any limit on how many times I can take this free course?
Once you enroll in the Data Visualisation in Tableau course, you have lifetime access. So, you can log in anytime and learn it for free online.
Can I sign up for multiple courses from Great Learning Academy at the same time?
Yes, you can enroll in as many courses as you want from Great Learning Academy. There is no limit to the number of courses you can enroll in at once, but since the courses offered by Great Learning Academy are free, we suggest you learn one by one to get the best out of the subject.
Why choose Great Learning Academy for this Data Visualisation in Tableau course?
Great Learning Academy provides this Data Visualisation in Tableau course for free online. The course is self-paced and helps you understand various topics that fall under the subject with solved problems and demonstrated examples. The course is carefully designed, keeping in mind to cater to both beginners and professionals, and is delivered by subject experts.
Great Learning is a global ed-tech platform dedicated to developing competent professionals. Great Learning Academy is an initiative by Great Learning that offers in-demand free online courses to help people advance in their jobs. More than 5 million learners from 140 countries have benefited from Great Learning Academy's free online courses with certificates. It is a one-stop place for all of a learner's goals.
What are the steps to enroll in this Data Visualisation in Tableau course?
Enrolling in any of the Great Learning Academy’s courses is just one step process. Sign-up for the course, you are interested in learning through your E-mail ID and start learning them for free online.
Will I have lifetime access to this free Data Visualisation in Tableau course?
Yes, once you enroll in the course, you will have lifetime access, where you can log in and learn whenever you want to.

Recommended Free Data Science courses
-
FREE

-
FREE
-
FREE
-
FREE
-
FREE
-
FREE
-
FREE
-
FREE
 FREE





Related Data Science Courses

-
12 weeks · Online
Know More
-
MIT Professional Education
Applied AI and Data Science Program15 Weeks · Live Online · Weekdays & Weekend
Know More
-
Deakin University
Master of Data Science (Global) Program24 Months · Online
Top 1% UniversityKnow More