Mastering Power BI is about more than just knowing its features. True professional skill comes when you use tools like DAX, data modeling, and visualization to solve real business problems.
The best way to get this practical experience is through Power BI projects. Each project you work on better your ability to handle the entire process, from connecting to raw data to building a final, interactive dashboard. Also, a portfolio of these projects can be proof of your skills to employers.
This guide gives you a list of real-world Power BI project ideas, along with the datasets you'll need, to help you build a professional portfolio and show you're ready for a data analytics job.
Data Visualization using Power BI
Learn how to transform raw data into meaningful insights with Power BI. This course covers essential visualization techniques to help you create compelling, interactive dashboards and reports.
What makes a good Power BI project?
Before we get to the project ideas, it is important to know what makes a project stand out. A great project usually has:
- A business question: A good project starts with a problem to solve. For example, "Which of our products are the most profitable, and in which regions?" is better than just, "Here is some sales data."
- Data cleaning and preparation: We all know real-world data is almost always messy. So using Power Query to clean, shape, and prepare data becomes a critical step.
- A perfect data model: This is the backbone of your report. A project that uses a proper star schema (with fact and dimension tables) results more impressively than one built from a single, flat file.
- Insightful calculations (DAX): A good project uses Data Analysis Expressions (DAX) to create custom calculations. Using simple sums and averages to create meaningful Key Performance Indicators (KPIs) is not scalable.
- Effective visuals and storytelling: The final report should be easy for anyone to understand. It should use the right charts and graphs to answer the business question and lead the user to important insights.
Where to find datasets for your projects
You need data to build projects. Below are the places to find free datasets to practice with.
- Kaggle is a good source for a huge variety of datasets, from movie ratings to global sales data.
- data.world: Here you can find open data on all sorts of topics.
- GitHub: Do a quick search for "sample csv datasets" and github will give you lots of repositories with clean, ready-to-use files.
Beginner Projects
Beginner projects are all about the core skills. You will practice connecting to data, creating basic charts, and using simple DAX calculations. Mastering these projects shows that you have a good understanding of Power BI's essential functions.
1. Sales Performance Dashboard
Objective: Create a single-page dashboard to track important sales metrics like revenue, units sold, and profit margin. You'll want to see how these numbers change across different regions, product categories, and customer types.
Key Skills You'll Learn:
- Connecting to Excel or CSV files.
- Building essential visuals like bar charts, line charts, and cards.
- Using slicers and filters to make the report interactive.
- Creating basic DAX measures like SUM() and COUNT().
Suggested Dataset: Superstore Sales Dataset on Kaggle
2. Human Resources Headcount Report
Objective: Build a report that analyzes employee headcount, turnover rates, and demographics. The goal is to give HR insights into the company's workforce and help them understand why people leave.
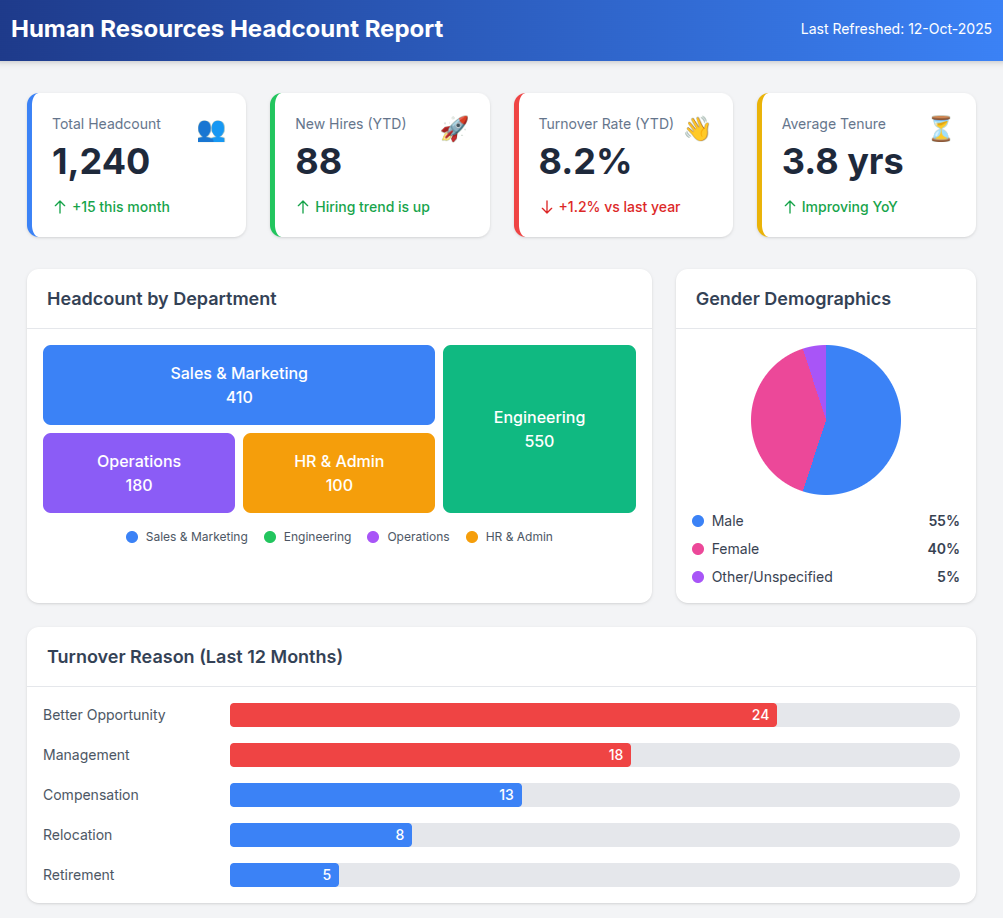
Key Skills You'll Learn:
- Working with date tables for time-based analysis.
- Creating calculated columns in both Power Query and DAX.
- Using visuals like pie charts and treemaps for categorical data.
- Using conditional formatting to make important data points pop.
Suggested Dataset: HR Analytics Dataset on Kaggle
3. Movie Ratings Analysis
Objective: Build an interactive dashboard to explore trends in the movie industry. You'll analyze movies by genre, release year, runtime, and audience ratings to figure out what makes a film successful.
Key Skills You'll Learn:
- Importing and cleaning data that might have errors or inconsistencies.
- Using visuals like histograms and scatter plots to see how data is distributed.
- Creating tooltips that show extra information when you hover over a visual.
- Sorting data and applying top N filters (e.g., Top 10 movies by revenue).
Suggested Dataset: The Movies Dataset on Kaggle
Intermediate Projects
Intermediate projects will challenge you with more complex data. You'll focus on data modeling, advanced Power Query steps, and more sophisticated DAX functions.
1. Customer Churn Analysis
Objective: Create an analytical model to figure out why customers are leaving (churning). The dashboard should show churn rates and highlight the common traits of customers who are likely to cancel their service.
Key Skills You'll Learn:
- Connecting to multiple tables and building a relational data model (star schema).
- Performing advanced data transformations in Power Query (like merging and appending queries).
- Writing intermediate DAX, especially CALCULATE() and FILTER().
- Using visuals like scatter plots and waterfall charts for deeper analysis.
Suggested Dataset: Telco Customer Churn Dataset on Kaggle
2. Website Traffic & SEO Analysis
Objective: Analyze website traffic data (from a source like Google Analytics) to understand user behavior, where visitors come from, and which pages are performing best. The goal is to find actionable insights to improve Search Engine Optimization (SEO).
Key Skills You'll Learn:
- Importing data from the web or connecting directly via APIs.
- Cleaning and transforming messy web data in Power Query.
- Using bookmarks and page navigation to create an experience that feels like a multi-page app.
- Creating custom tooltips to give your visuals more context.
Suggested Dataset: You can connect to your own Google Analytics account or use the Google Analytics Sample Dataset.
3. Supply Chain & Logistics Dashboard
Objective: Create a report to monitor key parts of a supply chain. You'll track inventory levels, shipping times, supplier performance, and transportation costs to find bottlenecks and ways to be more efficient.
Key Skills You'll Learn:
- Building a data model with multiple fact tables (e.g., one for Orders, another for Shipments).
- Using more advanced DAX for time calculations (like lead time and shipping delays).
- Implementing drill-through functionality to go from a summary page to a detail page.
- Using map visuals to display geographic data for shipping routes.
Suggested Dataset: Supply Chain Logistics Dataset on Kaggle
Advanced Projects
Advanced projects involve complex data models, advanced DAX patterns, and sometimes even integrating external tools.
1. Social Media Sentiment Analysis
Objective: Analyze social media posts (e.g., from X/Twitter) to see how the public feels about a specific product, brand, or topic. This project requires using external tools to process the text data.
Key Skills You'll Learn:
- Integrating Python or R scripts into Power BI for data processing and sentiment analysis.
- Working with unstructured text data.
- Implementing row-level security (RLS) to control who can see what data.
- Using advanced or custom visuals like word clouds.
Suggested Dataset: Twitter Sentiment Analysis Dataset on Kaggle
2. Financial Forecasting Model
Objective: Build a financial report that includes both historical analysis and future forecasting. The project involves creating a dynamic model to predict future revenue or expenses based on multiple assumptions.
Key Skills You'll Learn:
- Building complex financial data models.
- Writing advanced time-intelligence DAX functions (SAMEPERIODLASTYEAR, DATESYTD).
- Using "What-If" parameters to create interactive scenarios for your forecasts.
- Implementing calculation groups to avoid writing redundant measures.
Suggested Dataset: Financial Sample Workbook from Microsoft
3. Market Basket Analysis
Objective: Analyze sales transaction data to discover which products are frequently bought together. The goal is to give business insights for creating product bundles, designing store layouts, and planning marketing campaigns.
Key Skills You'll Learn:
- Handling large datasets with millions of rows efficiently.
- Writing advanced and non-intuitive DAX to find relationships between products.
- Creating a self-referencing relationship within a single table.
- Using network charts or custom matrix visuals to display how products are connected.
Suggested Dataset: Market Basket Optimization Dataset on Kaggle
A 5-Step Workflow for Any Power BI Project
No matter how complex the project is, following a structured workflow will keep you organized and on track.
- Define a goal: Write down the business questions you want to answer. For example, instead of "analyze sales," aim to "identify the top 5 most profitable products in the last quarter."Professional Power BI skill means using tools like DAX, data modeling, and visualization to solve business problems. The best way to gain this skill is by completing projects.
- Import and prepare Data: Connect to your data sources. Use Power Query to clean, reshape, and prepare your data for analysis. This is the most time-consuming but most important step.
- Model the Data: Organize your cleaned tables into a logical model, a star schema. Create relationships between your tables and add a dedicated date table.
- Visualize and Analyze: Start building your visuals on the report canvas. Write DAX measures to perform your calculations. Begin with high-level summaries and then add visuals that let users get into the details.
- Refine and Publish: Review your report for clarity, accuracy, and visual appeal. Add helpful titles, labels, and filters to make it user-friendly. Finally, publish it to the Power BI service to share with others.
Suggested: