Data analytics in 2026 reflects a shift in how organizations use data to make decisions. Analytics work today blends technical execution with reasoning, context, and responsibility. Cloud-native data platforms, AI-assisted tools, and growing data volumes shape how analysts work day to day. The most effective analysts understand how data moves from raw sources to business action and how each skill contributes to that journey.
Current Jobs and What Employers Look For in Data Analyst Candidates
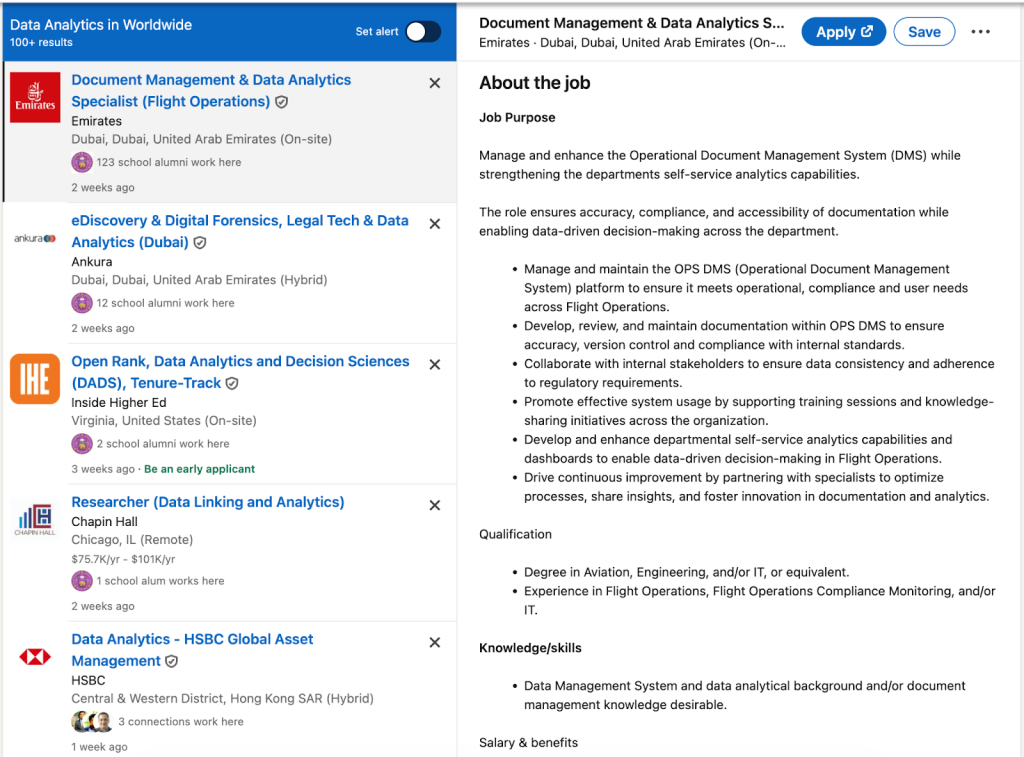
Data analysts work across industries such as technology, finance, healthcare, consulting, retail, and government. Roles range from entry-level data associate positions to mid-level analytics roles, where analysts collaborate with product teams and business leaders.
In many job postings, responsibilities include collecting and organizing data, cleaning and transforming datasets, performing statistical analysis, building reports and dashboards, and communicating insights to stakeholders. Employers expect analysts to help turn raw information into actionable outputs that support decisions and strategy.
Typical responsibilities seen in data analyst postings:
- Collect, clean, and organize data from multiple sources into usable formats.
- Analyze large datasets to uncover patterns and trends that inform business outcomes.
- Develop and maintain dashboards and visual reports to convey insights to business users.
- Translate analytical results into clear recommendations for decision-making.
- Collaborate with cross-functional teams to align analysis with strategic goals.
Hiring criteria in many current job descriptions often include both skills and qualifications, such as:
- Proficiency in SQL and familiarity with databases, including cloud-based systems.
- Experience working with Excel and at least one BI tool (such as Tableau or Power BI).
- Ability to clean, structure, and analyze datasets from various sources.
- Strong communication skills and ability to explain technical findings to non-technical audiences.
- Understanding of business performance metrics and how analytics supports decisions.
Some job descriptions also specify experience levels and tools, such as:
- 2–5 years of analytics experience and use of SQL, Excel, and visualization platforms.
- Collaboration with product teams, optimization work, or support for A/B testing and experimentation.
- Comfort with statistical techniques and ability to support predictive or trend forecasting work.
These patterns show that technical proficiency, a statistical foundation, data-handling skills, and clear communication are expected across many hiring contexts. Roles span industries and often involve translating data into strategic insight for business decisions.
Here are the top Data Analyst Skills you need to learn in 2026
The skills below represent what strong analytics work looks like in practice. Each skill is explained with context, followed by why it matters, a practical example, and a learning direction. Together, these skills form a complete analytics capability rather than a checklist of tools.
Core Technical Skills
1. SQL and databases
SQL remains the primary language for working with structured data. Analysts use SQL to query, join, filter, and aggregate data stored in relational databases and cloud data warehouses. Modern SQL work often involves complex joins, time-based window functions, nested data, and large tables. Understanding how databases store and retrieve data helps analysts write queries that stay readable, accurate, and efficient.
Why it matters
Most trusted business data lives in databases. Analysts who work confidently with SQL reduce delays, depend less on others, and move faster from question to insight. SQL proficiency also signals logical thinking and structured problem-solving.
Example
Create a query that calculates monthly retention by signup cohort, adjusts for refunds, and highlights regions with unusual churn.
Learning tip
Break complex queries into clear steps using CTEs. Prioritize correctness and readability before focusing on performance.
Editor recommendation
The SQL Data Analysis course from Great Learning focuses on analytical reasoning with realistic business schemas, helping learners build confidence with complex queries used in real analytics roles.
2. Excel as an Analytical Reasoning tool
Excel continues to play a meaningful role because it allows fast exploration and validation of ideas. Advanced Excel usage includes Power Query for data ingestion, pivot tables for multi-dimensional analysis, structured formulas, and AI-assisted features for pattern detection. Excel often serves as the first place where assumptions get tested.
Learn Excel for powerful data analysis and enhance your skills for better decision-making.
Why it matters
Many decisions begin with spreadsheet-based analysis. Analysts who structure spreadsheets clearly create trust and accelerate alignment across teams.
Example
Use Power Query to combine multiple exports, standardize timestamps, and create cohort summaries with pivot tables.
Learning tip
Treat Excel as a prototype environment. Clearly label assumptions and calculations so logic remains transparent.
Editor recommendation
Learn Data Analysis with Excel, which emphasizes Power Query, automation, and analytical structure that mirrors real workplace usage.
3. Python or R for reproducible workflows
Python and R convert manual analysis into repeatable processes. Python supports data manipulation, automation, and machine learning workflows. R excels in statistical exploration and expressive visualizations. Reproducibility defines strong practice, allowing analyses to run again as data updates.
Why it matters
Reusable scripts reduce errors, support collaboration, and enable scaling. Analysts who rely only on manual tools struggle as data volume and complexity increase.
Example
Build a script that ingests weekly data, validates schema consistency, cleans records, and outputs analytics-ready tables.
Learning tip
Write small reusable functions and save intermediate results to test assumptions during development.
Editor recommendation
The Python for Data Science course from Great Learning aligns with analytics workflows by focusing on data handling, automation patterns, and applied projects.
4. Data visualization and BI tools
Visualization transforms analysis into shared understanding. BI tools such as Tableau and Power BI support interactive dashboards, filters, alerts, and drill-downs. Strong visualization emphasizes clarity and purpose, with each visual tied to a specific decision.
Data Visualization using Power BI
Learn how to transform raw data into meaningful insights with Power BI. This course covers essential visualization techniques to help you create compelling, interactive dashboards and reports.
Why it matters
Dashboards guide daily actions across teams. Clear design prevents misinterpretation and supports faster decisions.
Example
Design a dashboard that highlights metric changes first, then enables investigation through filters.
Learning tip
Write the business question above each visual during design and remove charts that do not support a decision.
Editor recommendation
Great Learning’s Tableau course focuses on decision-oriented dashboards, layout discipline, and feedback-driven refinement.
5. Statistics, experimentation, and analytical judgment
Statistics provides tools to measure uncertainty, test hypotheses, and design experiments. Modern analytics relies on experimentation for product changes, pricing strategies, and marketing optimization. Analytical judgment combines statistical output with business context.
Why it matters
Metrics alone do not explain impact. Analysts must interpret results responsibly and communicate confidence and limitations clearly.
Example
Assess an experiment by comparing effect size with expected business impact rather than relying only on significance thresholds.
Learning tip
Practice explaining results in simple language while maintaining statistical accuracy.
Editor recommendation
The Statistics course for Data Science from Great Learning emphasizes applied interpretation and business-focused examples.
6. Data wrangling, cleaning, and management
Real-world data arrives incomplete and inconsistent. Data wrangling includes handling missing values, resolving duplicates, standardizing formats, and tracking data lineage. Data quality requires continuous attention rather than one-time fixes.
Why it matters
Decisions based on poor data carry risk. Analysts who surface data issues early build credibility and trust.
Example
Create validation checks that compare daily record counts and key metrics against historical ranges.
Learning tip
Document assumptions and edge cases alongside cleaning logic.
Advanced and Emerging Skills
1. Cloud analytics platforms
Analytics runs on cloud platforms where storage and compute scale independently. Analysts interact with these systems through SQL, notebooks, and BI tools. Platform awareness includes understanding cost drivers, storage formats, and performance trade-offs.
Why it matters
Efficient design reduces cost and improves responsiveness. Platform knowledge helps analysts write better queries and design scalable workflows.
Example
Partition a large events table to optimize time-based analysis.
Learning tip
Review execution summaries and cost metrics after each query.
2. Machine learning and AI literacy
Machine learning literacy involves understanding models, features, evaluation metrics, and limitations. Analysts often support feature engineering, validation, and interpretation rather than full model development. AI-assisted tools also enhance analysis speed.
Why it matters
AI-driven insights influence decisions. Analysts must understand model behavior to prevent misuse and explain outcomes responsibly.
Example
Compare a forecast model with a baseline and explain where predictions diverge.
Learning tip
Focus on interpretability and evaluation rather than algorithm variety.
Editor recommendation
The Introduction to Machine Learning course from Great Learning emphasizes applied understanding and responsible usage aligned with analytics roles.
3. Big data technologies
Big data technologies support analysis when data volume, velocity, or variety exceeds the limits of single-machine tools. Systems such as Apache Spark process data across distributed clusters, splitting work into smaller tasks that run in parallel. This approach supports event-level data, logs, sensor data, and large transactional datasets. Analysts do not need deep engineering expertise, but understanding how distributed processing works helps them design queries, transformations, and aggregations suited for scale. Familiarity with concepts such as partitions, shuffles, and lazy execution improves analytical efficiency and accuracy.
Why it matters
As organizations collect more granular data, traditional tools struggle with memory limits and processing time. Analysts who understand big data concepts choose appropriate tools early, avoid inefficient workflows, and collaborate more effectively with data engineering teams. This understanding reduces bottlenecks and ensures insights arrive within decision timelines.
Example
Aggregate billions of event records into daily active user metrics using Spark, then feed the results into a reporting table for dashboards.
Learning tip
Learn how distributed data gets partitioned, how joins behave at scale, and how aggregation strategies affect performance. Focus on reading execution plans and understanding where computation happens.
Editor recommendation
The Free Big Data and Hadoop course from Great Learning builds foundational understanding of distributed data processing concepts such as clusters, partitions, and parallel execution. It helps analysts grasp how large-scale datasets are stored and processed, enabling them to design scalable aggregations, interpret execution behavior, and work more effectively with tools like Spark in data-intensive analytics environments.
4. Data governance and ethics
Data governance defines how data gets collected, stored, accessed, and shared across an organization. This includes data ownership, access controls, quality standards, retention rules, and compliance with privacy regulations. Ethical data use extends beyond compliance. It includes fairness, transparency, and accountability in how data informs decisions. Analysts often sit closest to data usage, making their judgment critical in enforcing responsible practices.
Why it matters
Poor governance increases legal, financial, and reputational risk. Trust in analytics depends on confidence that data is accurate, secure, and used responsibly. Analysts who apply governance principles protect stakeholders and support long-term data credibility.
Example
Mask personal identifiers in shared datasets, restrict access to sensitive attributes, and document data sources and limitations in reports.
Learning tip
Understand privacy principles, access control models, and basic regulatory requirements. Practice documenting assumptions, limitations, and data lineage alongside analysis.
Soft Skills and Business Alignment
1. Critical thinking and problem solving
Critical thinking involves examining data beyond surface patterns. Analysts assess assumptions, test alternative explanations, and evaluate whether results align with the real-world context. Problem-solving connects analysis to root causes and viable actions rather than isolated observations.
Why it matters
Data often contains noise, bias, or misleading correlations. Analysts who question results prevent incorrect conclusions and guide teams toward meaningful solutions.
Example
Investigate a revenue decline by separating seasonality, customer mix changes, pricing effects, and data quality issues instead of accepting a single explanation.
Learning tip
Practice framing problems clearly before analysis. Ask why at each step and validate findings against business context.
Aspiring data analysts should focus on mastering tools that help transform raw data into actionable insights; combining spreadsheet analysis with a Free Power BI course can help beginners learn how to build clear and impactful data visualizations.
Free Data Visualization Power BI Course
Learn how to create interactive visualizations, understand their role in decision-making, and master Power BI’s core features in this course.
2. Communication and data storytelling
Data storytelling organizes insights into a clear narrative that links context, evidence, and recommendations. Strong storytelling highlights what changed, why it matters, and what action follows. Visuals, summaries, and structured explanations work together to guide understanding.
Why it matters
Insights only create value once they influence decisions. Clear communication aligns teams, reduces misinterpretation, and accelerates action.
Example
Present a concise summary that states the key insight, quantifies impact, and outlines the recommended next step supported by visuals.
Learning tip
Lead with conclusions, then support with evidence. Tailor language and visuals to the audience’s level of technical familiarity.
Editor recommendation
The Business Communication course from Great Learning complements data storytelling by strengthening how insights are structured, articulated, and presented to stakeholders. It helps learners translate data-backed findings into clear narratives, executive summaries, and actionable recommendations that drive alignment and decision-making.
3. Business acumen and domain understanding
Business acumen links analytical output to organizational goals, processes, and constraints. Domain understanding includes knowledge of industry metrics, customer behavior, operational workflows, and strategic priorities. This context shapes how analysts interpret data and define success.
Why it matters
Metrics carry different meanings across industries and functions. Analysts who understand the domain identify relevant signals more quickly and propose actions that align with operational reality.
Example
Analyze customer churn by mapping lifecycle stages and identifying which touchpoints influence retention rather than reporting overall churn alone.
Learning tip
Study how the business operates end-to-end. Learn key performance drivers, common risks, and decision cycles to align analysis with outcomes.
Final perspective
Strong analytics work in 2026 blends technical execution with judgment, clarity, and responsibility. SQL, statistics, visualization, and data management form the foundation. Cloud platforms, AI literacy, and big data awareness extend capability. Critical thinking, storytelling, and business understanding turn analysis into action.
Mastering these connected skills prepares analysts to deliver insight that matter as data environments continue to evolve.