A graph in Excel is a visual way to present your data from a spreadsheet. Using a graph makes it easier to understand information, find patterns, and see comparisons in your numbers.
Understanding Graph Types in Excel
With the right type, you could know how to draw a graph in an Excel sheet, how to insert a graph in Excel, or just know about MS Excel graph tools.
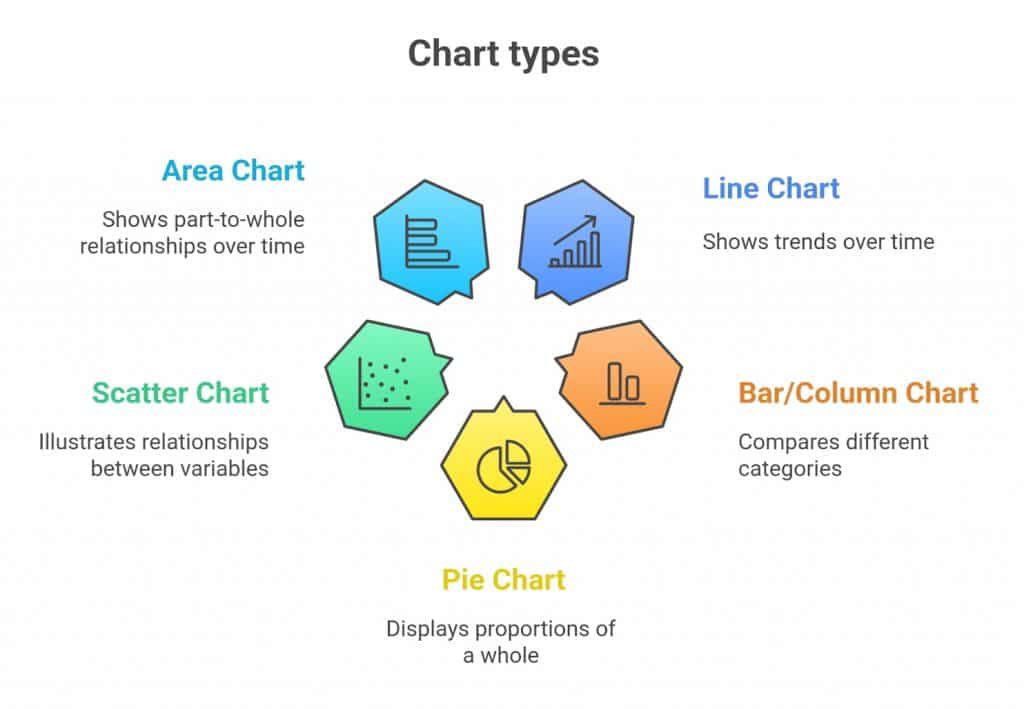
- To illustrate the trends over time, e.g., monthly revenue or web traffic, a Line Chart would be appropriate. It links the data points in a flowing manner and thus has become a favorite when there is a need to have a graph in Excel that will bring out the movement or change.
- The Column or Bar Chart is suitable for the comparison of various types. These charts are useful when making side-by-side comparisons or when comparing sales in different regions or team performance.
- Pie Charts represent percentages of a totality. They also come in handy when you are interested in the distribution of a budget or market share.
- Scatter Plots are ideal for the demonstration of connections between the two sets of variables, such as hours studied and grades. This form of Excel plot is useful in showing patterns and trends.
- Area Charts show part-to-whole changes over time, adding visual weight to trends.
Note- If you want to master Excel A to Z, you can take this Excel training course:
Learn Excel the smart way! Our course teaches you all the essential tools and techniques to master spreadsheets, from formulas to charts, and improve your workflow in every task you do.
Preparing Your Data for Graph
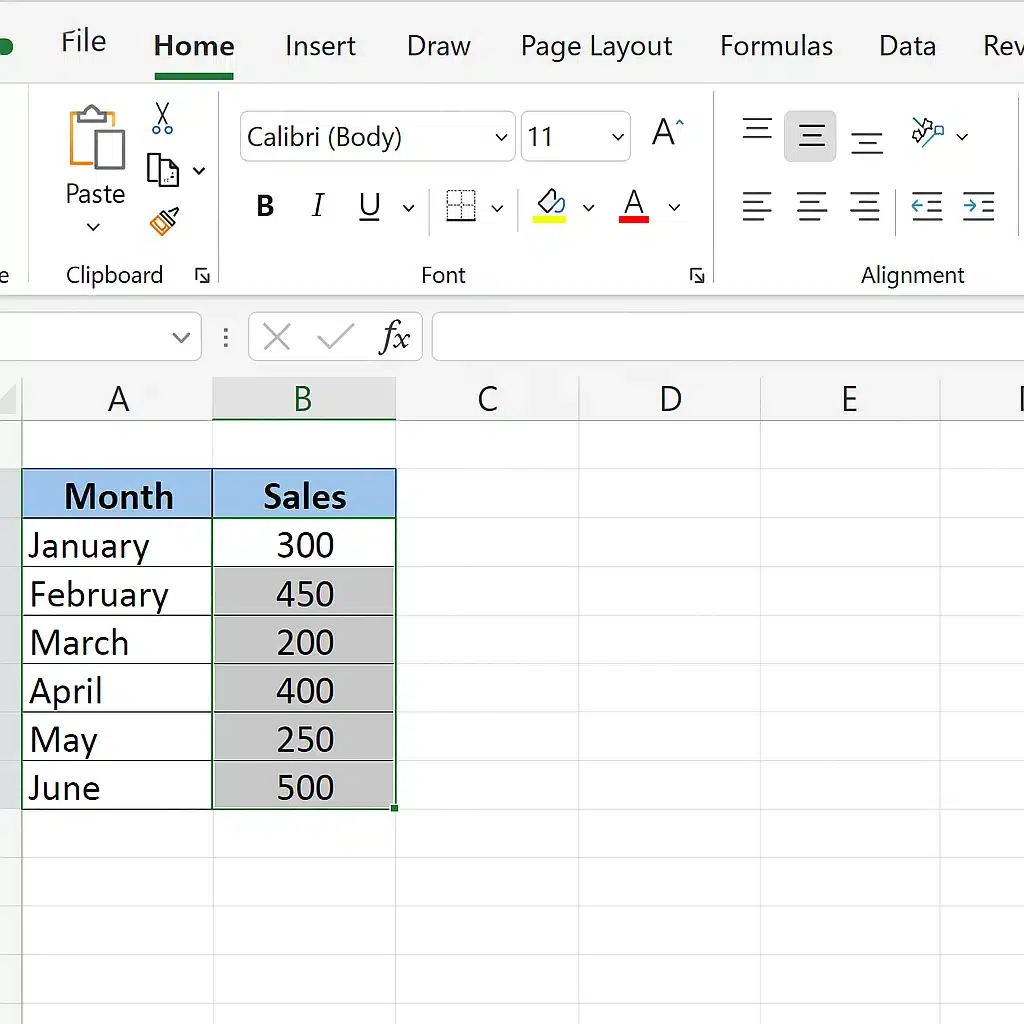
- Start by arranging your data in rows and columns. Place categories (like months or product names) in the first column, and values (like sales or responses) in the next.
- Always include clear headers. Excel uses these as labels when you plot a graph in Excel.
For example, if you’re working with sales data, your sheet might look like this:
| Month | Sales ($) |
| Jan | 5000 |
| Feb | 6200 |
| Mar | 5800 |
This layout helps Excel know exactly what to plot when you draw a graph in an Excel sheet or make a graph in an Excel sheet.
Avoid blank rows or merged cells, as they can confuse the MS Excel graph tools and affect the final result. If you're comparing values and want to add rankings before plotting, this guide to the RANK formula in Excel can help.
Excel for Beginners Free Course
Learn essential Excel skills for data analysis, including functions, formulas, and data visualization techniques. Master cell referencing, sorting, and creating charts and presentations.
Step-by-Step: Creating a Graph
Whether you're new to Excel or just need a quick refresher, this step-by-step guide will walk you through how to make a graph in an Excel sheet with clarity and style.
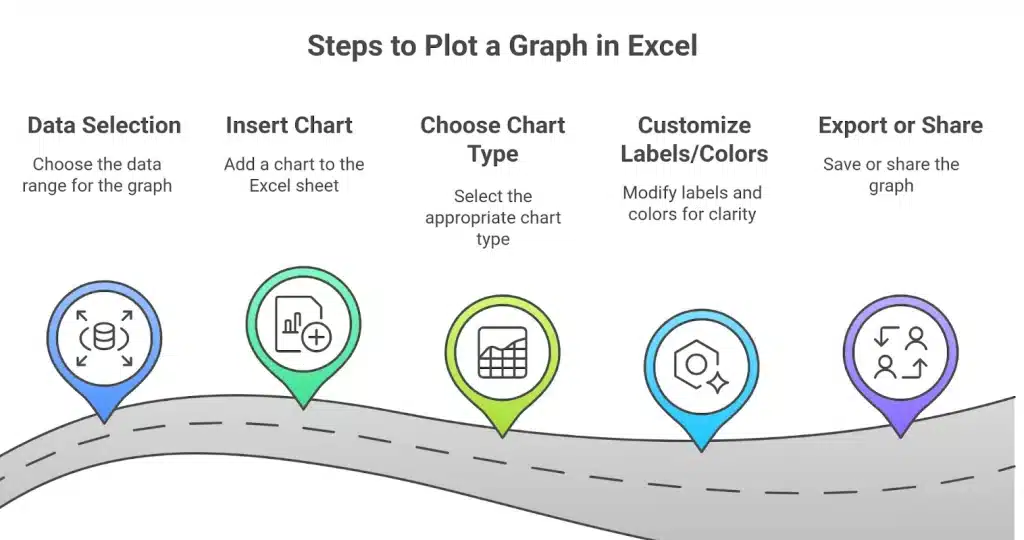
A. Select Your Data
Start by highlighting the range of data you want to include in the chart. Be sure to include headers so Excel can use them for labels.
For example, select the entire table with column names like “Month” and “Sales.” This is the first step in knowing how to draw a graph in Excel accurately.
B. Insert a Chart
Go to the Insert tab in the ribbon at the top of Excel. You can go to the Charts area, where there are several choices, including Column, Line, Pie, and others.
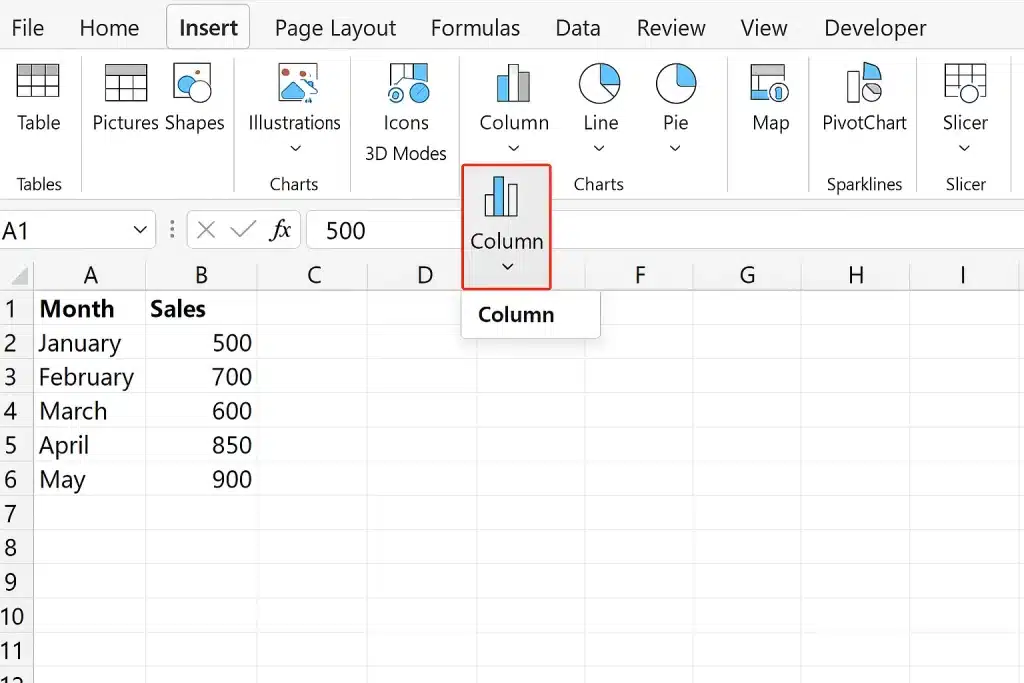
- Recommended Charts: Excel can help you choose the most compatible chart style for your chosen data. It helps when you’re not sure what type of algorithm to pick for your data.
- Manual Selection: If you already know what you want, like a scatter plot or area chart, choose it directly from the chart options.
Clicking your chosen chart will immediately insert a graph in Excel based on your selected data.
C. Customize the Chart
When the graph appears in MS Excel, you have the option to format it to boost its clarity.
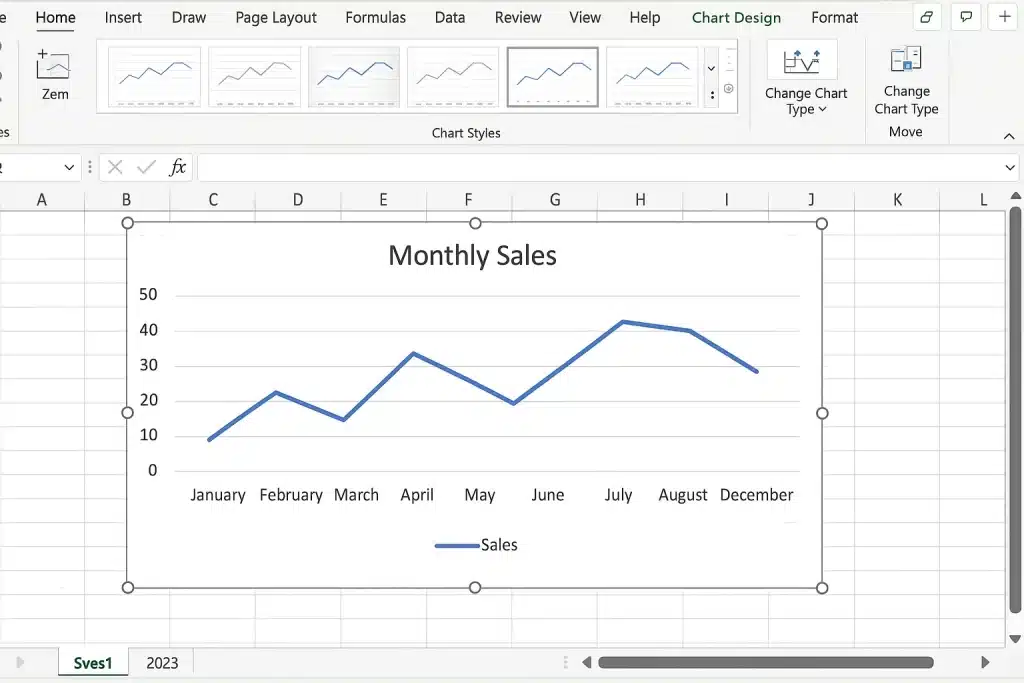
- Chart Title: You can set the Chart Title to “Monthly Sales” by clicking on the default title.
- Axis Labels: If necessary, put labels on the axes to show what year or month is on the X-axis and what is shown on the Y-axis.
- Legends: When you have numerous data lines, ensure the key makes it easy to identify every line or symbol.
- Colors and Styles: Use the Chart Design tab to adjust themes and styles to fit your presentation.
- Gridlines and Background: Remove unnecessary gridlines or change the background for a cleaner look.
With these steps, you now know how to plot a graph in Excel and personalize it to suit your needs.
Formatting Tips for Clarity
The following are some simple formatting rules to make your graph in an Excel sheet simpler and more efficient when you make a graph in Excel:
- Use contrasting colors: Use contrasting colors in every set of data so that they can be differentiated. Shades that are too bright or other similar shades should be avoided as they may mislead the viewers.
- Avoid clutter: Have a simple chart. Eliminate unwanted gridlines, additional labels, or distracting backgrounds. The important data stand out in a clean chart.
- Add data labels: Add data labels in order to display the exact values on your graph. This enables the readers to grasp the figures easily without having to guess.
- Adjust chart size and layout: You can make your chart to suit the space on a page or slide. Ensure that labels and legends are prominent and not congested.
- Use chart elements: Add trendlines to your chart to indicate trends over a specified period of time or use error bars to indicate the accuracy of the results. These details provide background and context.
These tips will help you plot a graph in Excel and have visuals that communicate effectively and appear professional. Formatting assists your readers in concentrating on what is important in your information.
Updating and Editing Your Graph
Once you insert a graph in Excel, it remains connected to the original dataset.
- You can enhance your charts by using key Excel formulas to prepare or transform data before plotting. This is because if you edit any numbers in the sheet, your chart will be automatically updated; you do not need to redo anything. It is one of the best things to know how to create a graph in an Excel sheet easily.
- You have the option to manually change various elements on the chart.
- Another way to enhance the chart would be to edit the title of the chart, the labels on the axes, or the colors to have a high contrast.
- In case you need to modify something, you have to first click on the element, and Excel will give you the formatting possibilities.
- Shifting data can sometimes mean you should use a different chart type.
From the drop-down menu, click “Change Chart Type” and change the bar chart to a line chart. This flexibility makes editing an MS Excel graph fast and intuitive.
Common Mistakes to Avoid
- Failing to be cautious when creating graphs using the Excel tool might make you display some results that are confusing or misleading.
- A significant problem is that incorrect data selection, omitted headers, or empty rows may put your whole chart off.
- Another mistake is putting in the wrong type of chart with your data i.e., failure to display the time data in a pie chart.
- Do not place too many colors, gridlines, or labels in diagrams than is necessary.
- An MS Excel graph with a few, well-structured elements is much more effective than one that is full of design features. Clear data and well-considered chart selections are worth a lot.
Conclusion
You now have the knowledge of how to draw a graph in an Excel sheet, so you can transform unstructured numbers into professional graphs, whether it is in choosing what data to include, what type of chart to use, or in formatting and sharing. Every level aids in making sense of your data.
Excel simplifies and intensifies the process of either putting together a graph in the Excel workbook to create a report, a presentation, or just to use the workbook personally. Do not stop at this point and develop your trendlines, combo chart, and interactivity.
FAQ Section
1. Why is my Excel chart not showing correctly?
If your chart looks off, double-check your data selection. Ensure there are no blank rows or merged cells, and that headers are properly labeled. Excel relies on a clean structure to plot accurately.
2. Can I plot multiple data series?
Yes, you can. Simply include multiple columns of values when selecting your data. It is easy to compare trends in Excel as it changes each column’s color or line pattern. If you wish, you can select each new series by opening the “Select Data” option after right-clicking the chart.
3. How do I create interactive charts?
For interactive data, you can include slicers, filters or drop-downs using named ranges. Although it requires some extra effort, you can let the Excel plot and charts interact, but the original data will stay the same. These tools are especially useful in dashboards or presentations and elevate how you create graphs in Excel to a more dynamic level.