
A numerical computing environment and programming language, MATLAB, was developed by MathWorks. It allows the plotting of functions, matrix manipulations, implementation of algorithms, interfacing with programs written in other languages, including C, C++, and Fortran, and creation of user interfaces. For all budding data science and machine learning professionals, learning MATLAB will help you to focus on areas such as architecture modeling, analysis environment, and Model-Based Design. We have compiled a list of the most frequently asked MATLAB Interview Questions along with their answers to help you prepare better and ace your upcoming interviews.
Commonly asked MATLAB interview questions
- What is MATLAB?
- How to install MATLAB?
- How to plot a graph in MATLAB?
- How to call a function in MATLAB?
- What is MATLAB used for?
- How to run MATLAB code?
- How to read images in MATLAB from a folder?
- How to write function in MATLAB?
- How to use for loop in MATLAB?
- How to solve differential equations in MATLAB?
Let's get started!
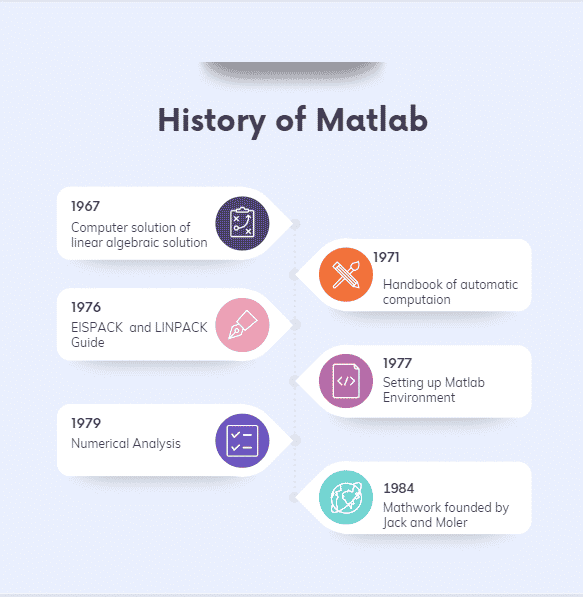
History of MATLAB
MATLAB Interview Questions
This section on MATLAB Interview Questions covers commonly asked questions during the interview process. Whether you are new to the interview process or are an experienced professional, learning these questions will help you increase your confidence and ace your upcoming interview.
What is MATLAB?
Ans. MATLAB is an acronym for MATrix LABoratory. It is an open-source software/API which was initially developed for mathematical calculations, including matrix operations. The latest software version can perform various complex calculations such as data analysis and visualization, scientific and engineering graphics, etc. Its prime features also include simulation and modeling.
Check out MATLAB course for free.
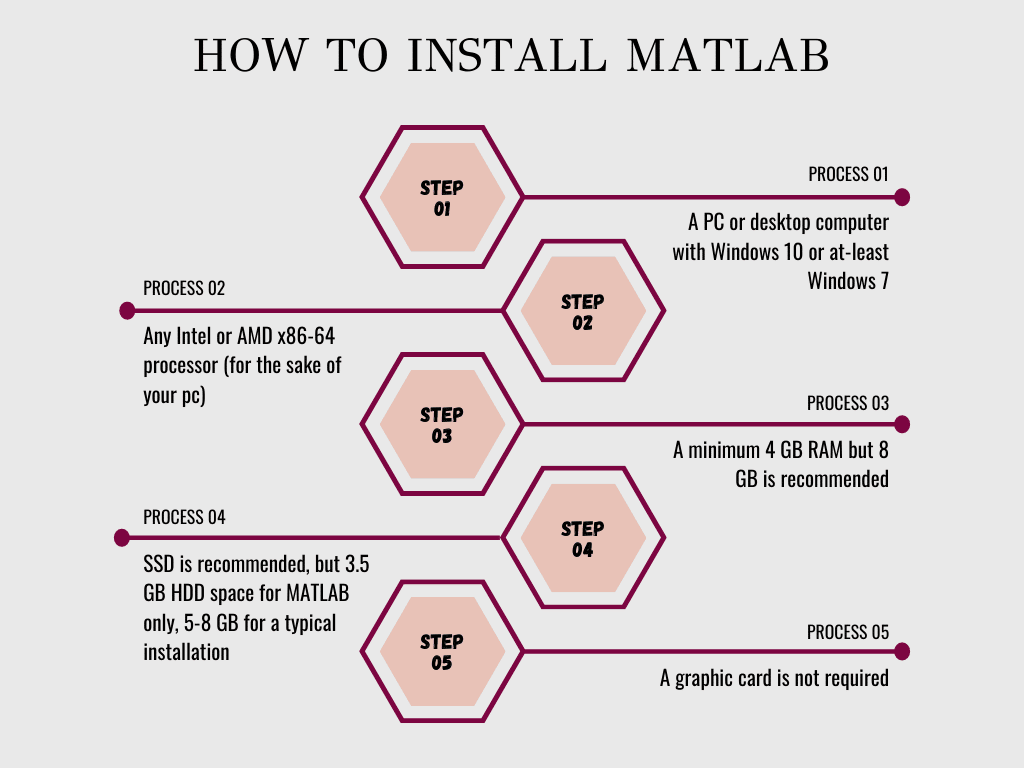
How to install MATLAB?
Ans. For installing the latest version of MATLAB, i.e., MATLAB R2020b:
Prerequisites (for Windows):
- A PC or desktop computer with Windows 10 or at-least Windows 7.
- Any Intel or AMD x86-64 processor (for the sake of your pc).
- A minimum of 4 GB RAM but 8 GB is recommended.
- SSD is recommended, but 3.5 GB HDD space for MATLAB only, 5-8 GB for a typical installation.
- A graphic card is not required.
Prerequisites (for Mac):
- macOS Big Sur (11) or macOS Catalina (10.15) or macOS Mojave (10.14).
- Any intel processor x86-64 processor.
- A minimum of 3.4 HDD space is required, but for a full installation space of 29 GB is required.
- A minimum of 4 GB RAM but 8 GB is recommended.
- A graphic card is not required.
Prerequisites (for Linux):
- Ubuntu versions after the one of 16.04 LTS, Debian 9 and newer versions, Red Hat Enterprise Linux 7 and newer, SUSE Linux Enterprise Desktop 12 and newer, and SUSE Linux Enterprise Server 12 and newer.
- Any Intel or AMD x86-64 processor.
- 3.3 GB of HDD space for MATLAB only, 5-8 GB for a typical installation. But an SSD is recommended.
- A full installation of all MathWorks products may take up to 28 GB of disk space.
- A minimum of 4 GB RAM but 8 GB is recommended.
- A graphic card is not required.
Installation is the same for all operating systems. You can download the software from any safe website such as its source mathworks.com or sourceforge.net. Simply open the browser, navigate to the URL above, and download the software.
But be aware of the fact that MATLAB is such a huge software with its latest update of more than 20 GB. It will not be installed overnight or in a single attempt. So, it is recommended to use any internet download manager to install it on a multi-day attempt.
How to plot a graph in MATLAB?
Ans. For any two points, x and y, with some values given, a function called plot (x, y) are used to plot a graph in MATLAB.
x : [value of array];
 y : [value of array];
plot(x, y)
How to call a function in MATLAB?
Ans. A function in MATLAB can be called using the name you give to the function, but first, it needs to be written in the New Script tab under the File Tab. You can simply call the function by writing the function’s name in the code area.
>> function_name (in the work area)What is MATLAB used for?
Ans. MATLAB language is a high-level matrix language. It has control structures, functions, data structures, input/ output, and OOP features. MATLAB API allows to the author of C and FORTRAN programs to interact with MATLAB. It is used for various industry-level designing processes and for running the control systems and automation of different types of machines by defining a particular set of codes for an object.
How to run MATLAB code?
Ans. NOTE: Before running any code, make sure you save the respective code so that your progress doesn’t fly away. Any code can run in MATLAB once it’s saved by using the Save and Run button in the home tab of MATLAB, or you can simply use the F5 key on your keyboard.
How to read images in MATLAB from a folder?
Ans. A syntax to read an image from any folder is given as:
D = 'directory where the files are saved';

S = dir(fullfile(D,'name*.jpg')); % pattern to match filenames.

for k = 1:numel(S)

    F = fullfile(D,S(k).name);

    I = imread(F);

    imshow(I)

    S(k).data = I; % optional, save data.

end
How to write functions in MATLAB?
Ans. A function can be written in MATLAB using the New Script option under the File tab.
Steps to write a function:
- Click on the file tab.
- Click on the New Script option.
- A new box will appear wherein you will get a syntax given as
function [y1, ...,yN] = function_name(x1, ...,xM)

end

function [y1, ...,yN] = myfun(x1, ...,xM) declares a function named function_name that accepts inputs x1, ...,xM and returns outputs y1, ...,yN.
Here you can write a function and save it in the folder.
How to use for loop in MATLAB?
Ans. A for loop is used to repeat a certain set of instructions a fixed number of times.
The syntax of for loop is:
for index = values
statements
end
for index = values, statements, end executes a group of statements in a loop for a specified number of times.
How to solve differential equations in MATLAB?
Ans. Any differential equation can be solved following a set of instructions and proper syntax. But for more accuracy, we use some solvers, casually known as ODE solvers in general, used for ordinary differential equations. Some of the commonly used ODE solvers are ode23, ode45, ode15s, and ode23s.
Syntax to solve differential equations in MATLAB:
- Create a function in an m-file to define the right-hand side of the equation to be solved.
- Determine the interval length for the independent variable tspan.
- Enter the initial conditions as n0.
- Call the solver to obtain the solution by typing the following command:
[t, y] = ode23(@function_name, tspan, n0)- The left-hand side of the command is the output argument containing two vectors. Other solvers, too, use a similar syntax.
After saving this script, we can call the function by its name or as the saved script name with given some initial conditions to get the answers.
How to read CSV files in MATLAB?
Ans. CSV stands for Comma-Separated Values. A command called csvread is generally used to read the CSV files but is not actually preferred.
Syntax:
M = csvread(filename)
The newer version of MATLAB instead recommends readmatrix to read such types of files.
Syntax:
A = readmatrix(filename)
What is MATLAB software?
Ans. MATLAB is a high-performance language for technical computing. Computation, visualization, and programming are integrated with MATLAB in an easy-to-use environment. It helps the user in the development of algorithms, complex calculations, simulation, modeling, and prototyping of data.
How to comment in MATLAB?
Ans. Comments in MATLAB can be inserted in between the codes. The syntax for comment goes like this:
“ % your comment goes here. ”
How to open SIMULINK in MATLAB?
Ans. SIMULINK can be easily accessed in MATLAB by the use of the Home tab. Simply go to the Home tab and click Simulink.
How to implement a neural network in MATLAB?
Ans. A neural network is an adaptive system that learns by using interconnected nodes or neurons in a layered structure that resembles a human brain. A neural network can learn from data, so it can be trained to recognize patterns, classify data, and forecast future events.
It breaks down the input into layers of abstraction. It can be trained using many examples to recognize patterns in speech or images, just as the human brain does. Its behavior is defined by how its individual elements are connected and by the strength or weights of those connections. MATLAB lets you develop neural networks with just a few lines of code.
The workflow for the general neural network design process has seven primary steps:
- Collect data
- Create the network
- Configure the network
- Initialize the weights and biases
- Train the network
- Validate the network (post-training analysis)
- Use the network
MATLAB and Deep Learning Toolbox provide command-line functions and apps for creating, training, and simulating shallow neural networks. The apps make it easy to develop neural networks for tasks such as classification, regression (including time-series regression), and clustering. After creating your networks in these tools, you can automatically generate MATLAB code to capture your work and automate tasks.
How to write for loop in MATLAB?
Ans. Here is presented an example of ‘for loop’ in MATLAB:
A = [3 6 9 4 1];
for i = 1:length(A)
disp(A(i))
end
As discussed earlier, a for loop is used is often used to assign to or access array elements iteratively.
How to create a matrix in MATLAB?
Ans. To create an array with n number of elements in m number of rows, separate the elements with either a space or a comma. For example, to create a matrix A of order 3 X 3, we write it as:
A = [ 21 92 43, 45 67 54, 72 88 91 ] The result to which will be represented as:
A = 3 X 3
21 92 43
45 67 54
72 88 91
How to create GUI in MATLAB?
Ans. Steps to create a GUI:
- Start GUIDE by typing guide at the MATLAB prompt.
- In the GUIDE Quick Start dialog box, select the Blank GUI (Default) template and then click OK.
- Display the names of the components in the component palette:
- Select File > Preferences > GUIDE.
- Select Show names in the component palette.
- Click OK.
Following the steps, you can start to create a GUI in MATLAB.
How to use SIMULINK in MATLAB?
Ans. SIMULINK in MATLAB is used to create a model for some process, for example, a simplified motion of a car or any control system process. When you use MATLAB ® and Simulink ® together, you combine textual and graphical programming to design your system in a simulation environment. SIMULINK can be accessed in MATLAB from the Home tab itself. SIMULINK is basically a graphical block diagramming tool with a customizable set of block libraries. When opened, Simulink opens with the Library Browser. The Library Browser is used for building simulation models.
On the left side window pane, you will find several libraries categorized on the basis of various systems; clicking on each one will display the design blocks on the right window pane. To create a new model, click the New button on the Library Browser's toolbar. This opens a new untitled model window. A Simulink model is a block diagram.
Model elements are added by selecting the appropriate elements from the Library Browser and dragging them into the Model window. Alternatively, you can copy and paste the model elements into the model window. Here you can choose any model based on your choice of developing any project.
How to stop a program in MATLAB?
Ans. You can simply use the quit command to stop a program in MATLAB or the desktop shortcut such as Ctrl + C.
How to plot a circle in MATLAB?
Ans. You can use this given an example, or the syntax, to plot a circle in MATLAB.
Here is a MATLAB function that plots a circle with radius 'r' and locates the center at the coordinates 'x' and 'y':
function h = circle(x, y, r)
hold on
th = 0 : pi/50 : 2 * pi;
xunit = r * cos(th) + x;
yunit = r * sin(th) + y;
h = plot(xunit, yunit);
hold off
And you can run the code in the workspace by typing the word ‘circle’ and the input conditions.
How to interface ARDUINO in MATLAB?
Ans. Steps to interface ARDUINO with MATLAB:
- Start MATLAB and click the Add-Ons drop-down menu. In the drop-down menu, click Get Hardware Support Packages. It will start the package installer window.
- Select Install from the Internet and click Next.
- In the next window, you will see all the available packages for MATLAB and Simulink. Select the Arduino package, then check all the packages displayed and click Next to continue the installation.
- Next, the installer will ask you to log in to your MathWorks account. If you don’t have an account, you can create one during installation. Accept the license agreement on the next screen and continue to download the packages. Now you have to wait for MATLAB to download and install all the required packages.
How to check if the connection is successful:
Once the packages are installed, connect your Arduino board to your PC and type the following command in the MATLAB command window,
>> a = arduino()MATLAB will then attempt to communicate with your board. If successful, MATLAB will display the properties of the Arduino board connected to your PC.
How to import data from EXCEL in MATLAB?
Ans. You can do this by clicking the Import Data icon under the Home tab and navigating to the Excel file you want to import. It's just a simple step.
How to remove the background from an image in MATLAB?
Ans. These are some steps to remove background images in MATLAB using color-based segmentation using K – means Clustering:
- Read the image. It follows the given syntax:
he = imread('hestain.png');
imshow(he), title('H&E image');
text(size(he,2),size(he,1)+15,...
'Image courtesy of Alan Partin, Johns Hopkins University', ...
'FontSize', 7, 'HorizontalAlignment', 'right' );
Where imread is the function to read the image named hestain.png.
- Convert the image from RGB color space to L*a*b*colour space
The L*a*b* color space is derived from the CIE XYZ tristimulus values. The L*a*b* space consists of a luminosity layer ' L* ', chromaticity-layer ' a* ' indicating where the color falls along the red-green axis, and chromaticity-layer ' b* ' indicating where the color falls along the blue-yellow axis. All of the color information is in the ' a* ' and ' b* ' layers.
It follows the syntax:
lab he = rgb2lab(he);
- Classify the colors in the 'a*b*' Space Using K-Means Clustering.
Clustering is a way to separate groups of objects. K-means clustering treats each object as having a location in space. It finds partitions such that objects within each cluster are as close to each other as possible and as far from objects in other clusters as possible. K-means clustering requires that you specify the number of clusters to be partitioned and a distance metric to quantify how close two objects are to each other.
ab = lab_he(: , : , 2:3);
ab = im2single(ab);
nColors = 3;
% repeat the clustering 3 times to avoid local minima
pixel_labels = imsegkmeans( ab, nColors, 'NumAttempts', 3);
For every object in your input, imsegkmeans returns an index, or a label, corresponding to a cluster. Label every pixel in the image with its pixel label.
How to implement SVM in MATLAB?
Ans. A support vector machine (SVM) is a supervised learning algorithm used for many classification and regression problems, including signal processing medical applications, natural language processing, and speech and image recognition. The main goal of the SVM algorithm is to separate data points of one class from those of another class to the best degree possible.
Support vectors refer to a subset of the training observations that identify the location of the separating hyperplane. The standard SVM algorithm is formulated for binary classification problems, and multiclass problems are typically reduced to a series of binary ones. You can use a support vector machine (SVM) when your data has exactly two classes.
How to add a toolbox in MATLAB?
Ans. To create a toolbox installation file:
- In the Environment section of the Home tab, select Package Toolbox from the Add-Ons menu.
- Click the 'plus' button in the Package a Toolbox dialog box and select your toolbox folder. Creating the toolbox package from the folder level above your toolbox folder is good practice. The .mltbx toolbox file contains information about the path settings for your toolbox files and folders. By default, any of the included folders and files that are on your path when you create the toolbox appear on their paths after the end users install the toolbox.
- Add the information about your toolboxes in the dialog box, such as ToolBox name, version, Author name, email and Company, ToolBox image, its summary, and description.
- Clicking Package at the top of the Package a Toolbox dialog box to save your toolbox. Packaging your toolbox generates a .mltbx file in your current MATLAB folder.
How to add the path in MATLAB?
Ans. A MATLAB function named addpath is used to add a path in MATLAB.
The syntax for addpath goes as:
addpath( 'directory' )
or
addpath( 'dir', 'dir2', 'dir3' ...)
Here addpath( 'directory' ) prepends the specified directory to the current MATLAB search path; that is, it adds them to the top of the path. Use the full pathname for the directory.
addpath( 'dir', 'dir2', 'dir3' ...) prepends all the specified directories to the path. Use the full pathname for each dir.
As an alternative to the addpath function, use the Set Path dialog box. To open it, select Set Path from the File menu on the MATLAB desktop.
We use the Set Path dialog box for the following:
- Viewing the Search Path
- Adding Directories to the Search Path
- Moving Directories Within the Search Path
- Removing Directories from the Search Path
- Restoring the Default Search Path
- Reverting to the Previous Path
- Saving Settings to the Path
- Editing pathdef.m
How to declare an array in MATLAB?
Ans. An array can be declared in MATLAB using the following syntax:
A = [1 2 3 4 5]
It creates an array of 1X5.
Or it can be declared in the following syntax:
N=[1,2,3,4,5]
It also creates an array of the same 1X5 dimension.
How to calculate classification accuracy in MATLAB?
Ans. Here's one approach we may try:
% output= evalfis( fis, input);
pred = round(output);
acc_count = nnz( pred==input);
acc = acc_count/length(input);
Here we consider round values of the fuzzy system as the predictions obtained and then count the number of correct predictions over the total number of inputs.
How to generate sine waves in MATLAB?
Ans. A program to generate a sine wave in MATLAB is given below:
t = 0:0.01:2;
w = 5;
a = 4;
st = a*sin(w*t);
plot(t, st);
Using this program and altering the values of ‘t’, ‘w’, and ‘a’, we can further generate longer sine waves.
How to read the audio files in MATLAB?
Ans. Here is the syntax to read audio files in MATLAB:
[y, Fs] = audioread(filename)
Here it reads data from the file named filename and returns sampled data, y, and a sample rate for that data, Fs.
How to resize an image in MATLAB?
Ans. Image resize in MATLAB can be done by using the following syntax:
J = imresize( I, scale)
The above-given syntax returns image J, which is scaled times the size of I. The input image I can be grayscale, RGB, binary, or categorical image.
How to comment on multiple lines in MATLAB?
Ans. Multiple line comments in MATLAB can be made using the syntax:
%{
Comments go here
%}
What is the MATLAB working environment?
Ans. MATLAB working environment has various tools to work with MATLAB. It has facilities to manage variables. MATLAB supports the export and import of data across applications. Certain tools are available to develop and manage MATLAB files. Debugging and profiling of MATLAB applications are more flexible with MATLAB. The blank space between the functions and command history box is where we can write the codes.
Explain how polynomials can be expressed in MATLAB.
Ans. There are a number of ways in which a polynomial function can be expressed in MATLAB. Polynomials are equations of a single variable with nonnegative integer exponents. MATLAB represents polynomials with numeric vectors containing the polynomial coefficients ordered by descending power. For example, [1 -4 4] corresponds to x2 - 4x + 4. Some of the functions are:
Poly, polyeig, polyfit, residue, roots, polyval etc.
Explain handle graphics in MATLAB.
Ans. Handle Graphics is a subsystem of MATLAB that handles graphics. It has high-level commands for 2D and 3D data visualization. Image processing, animation, and presentation graphics can be generated using Handle Graphics. Low-level commands allow customizing the graphics' appearances. Handle Graphics allows to build of customized Graphics User Interfaces.
What are the types of loops that MATLAB provides?
Ans. MATLAB provides three types of loops, just like any other programming language, which are:
- For loop
- While loop
- Nested loops (if-else, elif, etc).
What are 3D-Visualization elements in MATLAB?
Ans. 3D-visualization elements let MATLAB deal with the 3D graphics. These are some of the 3D-visualization elements in MATLAB:
- Surface and Mesh plots – Includes plot matrices and color maps.
- Lightning – Used for adding and controlling scene lighting.
- Transparency – Used to specify object transparency.
- Volume visualization – Used for the volume data grid.
What are memory management functions in MATLAB?
Ans. There are basically five types of memory management functions in MATLAB, which are:
1. clear - Removes variables from memory.
2. pack - Saves the existing variables to disk and then reloads them contiguously.
3. save - Selectively persists variables to disk.
4. load - Reloads a data file saved with the save function.
5. quit - Exits MATLAB and returns all allocated memory to the system.
What do you mean by M-file in MATLAB?
Ans. An M file is a text file used by MATLAB. It can store a script, class, or individual function in the MATLAB language. M files are used for executing algorithms, plotting graphs, and performing other mathematical operations. It is the basic type of file that MATLAB has. The extension for the m file is .m . Any file with the extension .m is an m-file.
What are MEX files?
Ans. A MEX file is a function created in MATLAB that calls a C/C++ program or a Fortran subroutine. A MEX function behaves just like a MATLAB script or function.
The MEX file contains only one function or subroutine. The calling syntax depends on the input and output arguments defined by the MEX function. The MEX file must be on your MATLAB path.
What are standard toolboxes present in MATLAB? How can they be accessed?
Ans. There are a variety of toolboxes present in MATLAB, some of which are:
- Optimization
- Neural Networks
- Partial Differential Equations
- Image processing
- Statistics
- Wavelets
- Control systems
And many more…
To access these toolboxes, simply go to the MATLAB start menu, after which choose the Toolboxes sub menu, then choose the Toolbox which we want to use.
What is Xmath?
Ans. Xmath is an interactive scripting and graphics environment for X-window workstations. It can script languages with OOP features. It is a debugging tool with GUI features.
Can we run MATLAB without graphics?
Ans. The answer is YES. We can run MATLAB without graphics too since it is a GUI. Also, at times, we can run the script codes without displaying the graphs.
What is a P-code?
Ans. P-code is a way to safe-key your source code such that others do not have any access to the source code of any of your projects. The original extension for a MATLAB file is .m, but for a p-code applied file is .p . A P-code file behaves the same as the MATLAB source. When MATLAB P-codes a file, the file is obfuscated and not encrypted.
What is Stress Analysis in MATLAB?
Ans. Stress Analysis or Finite Element Analysis is a computational method for predicting how any object will react to real-world forces, heat, vibrations, etc. We are well aware of the fact that MATLAB is a multidimensional software that finds its application in various disciples of engineering; for example, mechanical engineering makes use of stress analysis to design automotive et al.
MATLAB Interview Questions FAQs
Q: What are the basics of MATLAB?
A: MATLAB is a tool used for technical computing, calculation, and visualization in a unified environment. The full form of MATLAB is MATrix LABoratory, so it is perfect for matrix manipulation and problem-solving that are related to Linear Algebra, Modelling, Simulation and Control applications, and many more.
Q: What is the full form for MATLAB?
A: The full form of MATLAB is MATrix LABoratory.
Q: Is MATLAB hard to learn?
A: Most people don’t find MATLAB hard to learn. The syntax is lenient; the development environment helps find errors, etc. In fact, in just 10-15 days, you can become a pro in MATLAB programming.
Q: What is the disadvantage of MATLAB?
A: One of the disadvantages of MATLAB is that it is an interpreted language, so it may perform slower as compared to a compiled language.
Q: Is MATLAB better than Python?
A: MATLAB is the fastest platform when the usage of certain MATLAB functions is avoided by code. Although slower, Python is often compared to MATLAB, especially for using over 12 processing cores while jobs are running in parallel.
Q: What to write commands in MATLAB?
A: To write commands in MATLAB, you must go to the menu and tap Commands. You then have to tap at the MATLAB cursor (>>) in order to open the keyboard. Now type MATLAB commands as you usually would. For example, MATLAB Mobile™ sends each command to the Cloud for assessment.
Q: Who uses MATLAB?
A: MATLAB is used by several engineers as well as scientists across the world for various applications. They use it in academia and industry, which include image and video processing, deep learning and machine learning, signal processing and communications, control systems, computational finance, test and measurement, and computational biology.
Q: What is MATLAB written in?
A: MATLAB has its own coding language, which is simple to use as compared to the other coding languages. Apart from this, you can also choose a language in which you would like to code. It comes with in-built compilers for most popular coding languages such as C, C++, and Java. You can change the language as per your preferences.
Q: Is MATLAB harder than Python?
A: MATLAB is the easiest and most highly productive computing environment for engineers as well as scientists. It uses the MATLAB language. This is the only top programming language that is dedicated to mathematical and technical computing. On the other hand, Python is called a general-purpose programming language.
Q: Is MATLAB worth learning in 2021?
A: MATLAB is important for those who want to build a career in mathematics (abstract or applied), science, engineering, computational biology, physics, or data-oriented finance. The answer is yes, it is worth learning.
Hope these questions have helped you to understand the core concepts of MATLAB better and prepare for the interview. For more learning content on Data Science and Machine Learning, visit Great Learning Academy, where you will find various courses for professionals for free.
Also, Read the Top 25 Common Interview Questions