Free Data Visualization in Python Course
Data Visualization using Python
 4.55
Intermediate level
3.0 learning hrs
4.55
Intermediate level
3.0 learning hrs
Free Python data visualization course covering Matplotlib, Seaborn, and Plotly. Learn to compare plots, work with real datasets, and create clear visual insights using Python.
Instructor:
Mr. Gurumoorthy Pattabiraman




About this course
This free course introduces data visualization in Python and focuses on building practical skills using popular libraries. You will learn how to work with Matplotlib, Seaborn, and Plotly through clear code examples. The course explains how different plots work and how to choose the right chart for different data types. You will practice comparing plots using real datasets such as the Automobile dataset to understand patterns, trends, and insights.
You will also work with multiple datasets using Python tools such as Numpy and Pandas. The course includes hands on practice with Kaggle Automobile and Game datasets and shows how to visualize data using Seaborn. By the end of the course, you will know how to clean data, explore datasets, and present insights using effective visualizations.
After completing this course, you will feel confident creating and comparing data visualizations in Python for analysis and reporting. You will gain practical experience working with real datasets and writing visualization focused code. This course suits beginners who want to learn data visualization, students exploring data analysis, and professionals who want to improve Python data visualization skills using real examples.
Course outline
Packages for Data Visualization in Python
In this section, you will understand to work with Matplotlib, Seaborn, and Plotly Python packages for data visualization through demonstrated code snippets.
Comparing different Plots in Python
This section gives you a hands-on demonstration to learn visualization techniques and compare different plots. It uses the Automobile dataset to explain the concepts thoroughly.
Working and Visualising different datasets in Python
This section includes Python packages demonstration and sample problems to work with Numpy, Pandas with Kaggle Automobile and Game dataset, and Seaborn with Kaggle Game dataset.
Get access to the complete curriculum once you enroll in the course
 4.55
4.55
Level up with advanced skills & become job ready with Pro+
Subscribe to Pro+ today to build skills with 50+ Pro courses and prep for jobs with advanced AI tools.
 PRO
PRO

Practice exercises
Guided Projects
AI Resume Builder
AI mock interviews













What our learners enjoyed the most
Skill & tools
67% of learners found all the desired skills & tools
Our course instructor

Mr. Gurumoorthy Pattabiraman
Faculty, Data Science & ML, Great Learning
Machine Learning Expert


Frequently Asked Questions
Will I receive a certificate upon completing this free course?
Is this course free?
What prerequisites are required to learn this Data Visualization using Python course?
The free Data Visualization course requires you to have basic knowledge of Python programming. Anyone with Python skills can take the course and start learning from it without prior knowledge.
How long does it take to complete learning Python for Data Visualization free course?
The course contains two and a half hours of video content that you can finish at your own convenience. Great Learning Academy courses are self-paced and can be finished whenever you get time.
Will I have lifetime access to this free course?
Yes, the Great Learning Academy free course comes with lifetime access. Any learner who wants to brush up on their skills can revisit and take the course again.
What are my next learning options after this course?
You can refer to the attached course study materials and work on the sample problems to strengthen your skills. Also, enthusiasts of the field can opt for Great Learning’s professional AI and Machine Learning course that covers all the essential skills to build one’s career.
Is it worth learning Data Visualization with skills in Python?
Yes, Data Visualization is an essential part of Machine Learning. Learners looking to build a career in the Data Science domain also need an understanding of Data Visualization. So, it provides excellent worth learning Data Visualization with competency in Python for Machine Learning enthusiasts.
What is Data Visualization used for?
The graphic depiction of data and information is the focus of the interdisciplinary topic of data and information visualization. It is a particularly effective method of communication when the data or information is large, such as a time series.
Why is Data Visualization so popular?
Data visualization organizes the data into an understandable format and showing the trends and outliers, and assists in the presentation of data. A strong visualization highlights important information while reducing data noise.
What jobs demand that you learn Python for Data Visualization?
- Data Science and Machine Learning are the fastest-growing fields, and many jobs require learning Python for Data Visualization. Some of these jobs are:
- Data Administrator
- Data Engineer
- Data Scientist
- ML Engineer
- Business IT Analyst
- Data Architect
- Market Analyst
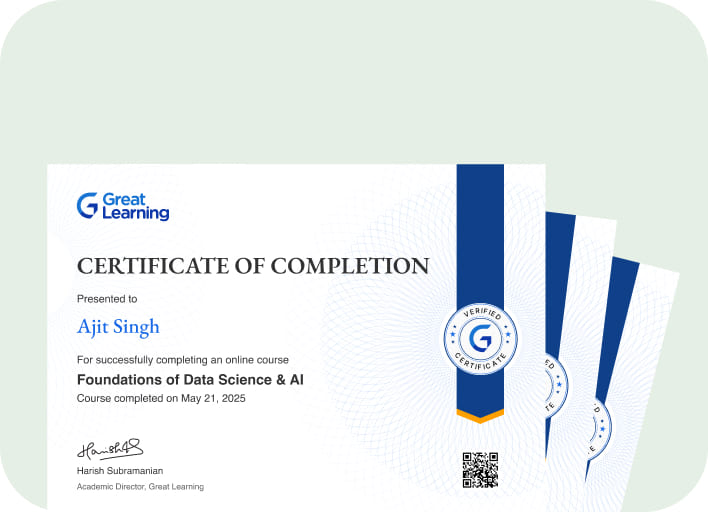
Will I get a certificate after completing this course?
Yes, once you finish the course modules, you can take the quiz that will reward you with a course completion certificate. The certificate showcases your skills and imparts value to your professional career.
What knowledge and skills will I gain upon completing this course?
This free course will help you to understand the fundamental concepts of Data Visualization and imparts skills in Python to work with different packages for Data Science and Machine Learning tasks. The course is beneficial for developing Python skills to work with Data Visualization for the learner.
How much does learning Python for the Data Visualization course cost?
The course is entirely free of cost. So any learner can enroll in this course and start learning to work with Python packages for Data Visualization purposes.
Is there a limit on how many times I can take this Data Visualization course?
No, the course doesn’t set any limit to taking it. Learners can take this course as many times as they want. Hence, whenever you feel like revising your learnings, you can revisit the course and start learning again.
Can I sign up for multiple courses from Great Learning Academy at the same time?
Yes, there are a number of courses you can enroll in and start learning. You can sign up for as multiple courses as you want to enroll in simultaneously with Great Learning Academy.
Why choose Great Learning Academy to learn Python programming for the Data Visualization course?
Great Learning Academy is an extensive platform that provides self-paced courses in various domains. Learners take benefit from these courses in their professional careers. There are more than 5 million learners worldwide who are benefitted from these courses. This course is helpful for enthusiasts looking forward to building a career in the Data Science domain. This course will familiarize you with Python packages to work on datasets, and helps you present data, and compare them.
Who is eligible to take this Data Visualization course?
The free course can cater well to you if you have basic knowledge of working with Python programming. Hence, any learner with the intent to learn Data Visualization and acquire skills in Python can take the course without any nudge.
What are the steps to enroll in this course?
You need to follow the steps below to enroll in this course:
1. Visit the Great Learning Academy homepage.
2. Search for the course in ‘Data Visualization Using Python’.
3. Now click on the ‘Enroll for Free’ button.
4. Register yourself with Great Learning Academy to enroll in any course by providing the required details and start learning the course for free.
Recommended Free Machine Learning courses
 FREE
FREE



Similar courses you might like


Related Machine Learning Courses

-

6 Weeks · Online · Weekend
Money Back GuaranteeKnow More
-
Johns Hopkins University
Certificate Program in AI Business Strategy10 weeks · Online
Know More
-
Walsh College
MS in Artificial Intelligence & Machine Learning2 Years · Online
Know More