
Contributed by: P. Renukadevi
- Introduction
- Descriptive Statistics
- Measure of Central Tendency
- Measure of dispersion
- Inferential Statistics
- Steps in Hypothesis testing
Introduction
Statistics is as old as human life. This is evident from the data that was collected by kings and their ministers on the population of their kingdom, the area of cultivation, the volume of products, etc., so that they can make wise decisions on meeting the minimum demands of the people like food, water, clothing, shelter, and safety. This indicates the importance of data.
It is also important to understand the difference between data and information. Data is a collection of raw facts and figures. When these data are processed scientifically, they become information, and when the information is used for decision making and retained for future use, they become knowledge. Statistics is a field of study that helps in the scientific processing of data.

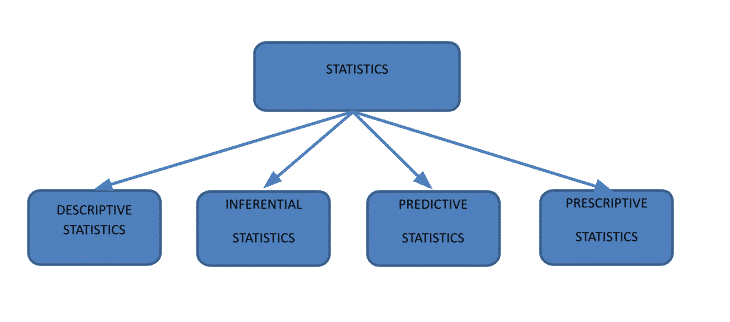
Statistics, based on their application, can be classified as descriptive statistics, inferential statistics, predictive statistics, and prescriptive statistics. In this article, an attempt has been made to understand the two important classifications, descriptive statistics and inferential statistics.
Statistics Course for Data Science and Analytics
Learn statistical methods crucial for data science, including regression and hypothesis testing, to extract valuable insights from data.
Descriptive Statistics
Descriptive statistics is used to summarize a large amount of data in a precise way so that it describes the whole data. Usually, descriptive statistics is used to understand what has happened using historical data. For example, the average run scored by Virat Kohli in ODI is 59.33. This average score describes the performance of the player in the matches he has played so far. In descriptive statistics, there are several measures that help us understand the pattern of the data. They are classified under two heads, Measures of central tendency and measures of dispersion.
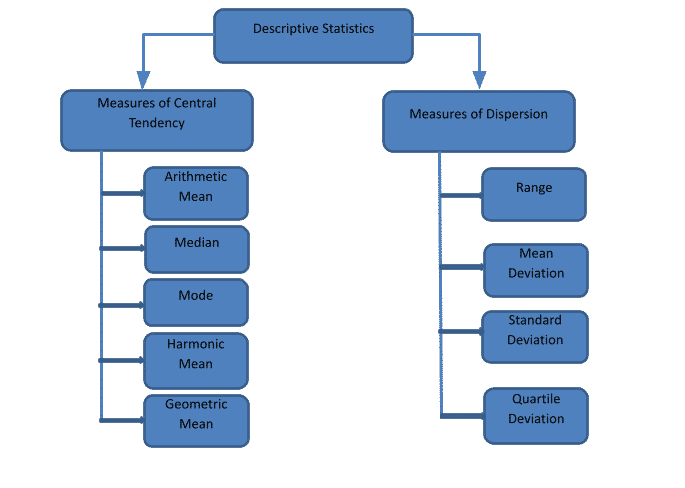
Measure of Central Tendency
This measures the central value of the distribution. It is also called the measure of location. It is the central tendency of the entire data, i.e., all the observations in the data tend towards this central value. Arithmetic mean is the sum of all observations divided by the total number of observations. Arithmetic mean is the best representation of the data when there are no extreme values in the data. Median is the measure that lies exactly in the center when the data is arranged in either ascending or descending order. Mode is the value that occurs most frequently in the data. The harmonic mean is the best measure of central tendency when the data are in rates and ratios. The geometric mean is used when we must average the percentages and rates of change.
Measure of dispersion
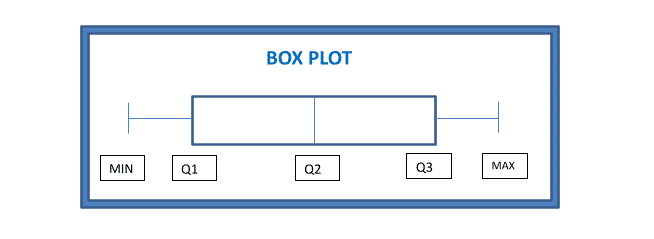
Dispersion measures how scattered the data is around the mean. It is also called the distance measure as it measures the distance between the average and all the other values in the data. The simple measure of dispersion is the range, which is the difference between the maximum and minimum values in the data. The most frequently used measure of dispersion is standard deviation which measures the root mean of squared distance between the mean and the other observations. The quartile deviation is used to understand the distribution of the data and to identify the outliers. Box plot is a visual representation of a five-point summary of the data such as minimum value, maximum value, median (Q2), first quartile (Q1), and second quartile (Q2).
Also Read: Understanding Distributions in Statistics
Inferential Statistics
Descriptive statistics need not be verified and can be relied on with 100% confidence to make a decision, provided if the data is collected from the entire population. When the population is very large, then collecting the data, compiling them, and calculating descriptive statistics, sometimes accuracy, will be a cumbersome process. For example, an HR manager may be interested in understanding the effectiveness of training in the performance of the employees. He has to make the decision based on the available data, and most of the time, it is done through sampling. So, a representative part of the population called ‘sample’ will be taken from the population. All the summary measures, such as mean, median, mode, standard deviation, quartiles, etc., are calculated for this sample. If a summary measure is calculated for population, it is called ‘parameter,’ and if the summary measure is calculated for sample, it is called ‘statistic.’ These statistics calculated from the sample are used to infer the population. This part of inferential statistics is known as Parameter estimation. Making inferences about the population from the sample data involve uncertainties, i.e., the sample statistic may or may not be equal to the population parameter. This uncertainty is to be reduced. The sample statistic should be very close to the parameter. Here one seeks the help of probability distribution. Every data is expected to follow a certain probability distribution. Generally, large data (sample size, n>=30) follows Normal Distribution, and small samples (n<30) follow their own distribution. The probabilities that we get from this distribution will help us to ensure whether the statistics are closer to the parameter or not. This is statistically experimented with the help of the concepts Testing of Hypothesis and Testing of Significance. This analysis of inferring about the population through a sample is called inferential statistics.
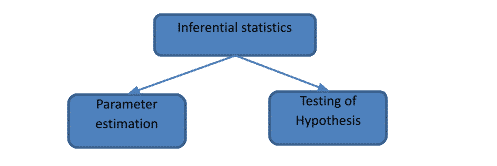
In order to understand the effectiveness of training, the HP manager collects sample data, computes the sample statistics. The HR manager will set an assumption that the training has not improved the employees’ performance. The HR manager will accept or reject this assumption using a well-defined scientific methodology called hypothesis testing. To have a better understanding and application of hypothesis testing, the support of probability theory and the probability distribution is necessary.
Steps in Hypothesis testing
The following are the steps involved in hypothesis testing.
Step 1: Setting of Null and alternate hypotheses.
Step 2: Identifying appropriate statistical test
Step 3: Setting the level of significance
Step 4: Set the decision rule
Step 5: calculate the test statistics using the sample statistics
Step 6: Compare the test statistics with the predefined table value.
Step 7: Arrive at a statistical inference and its business implications
To conclude, descriptive statistics helps the decision-maker to find the answer to the question, “What has happened?” from the historical data. Inferential statistics helps the decision-maker to infer about the population using the sample data. Descriptive statistics are straightforward measures, whereas inferential statistics is holistic through which the decision-maker tests his assumption. Descriptive statistics and inferential statistics confirm the decision-maker, whether the data can be used for predicting the future and prescribing the solution if a problem exists. Check out this Statistics for machine learning course to further your learning.