- Introduction
- Population and Sample
- What is Inferential Statistics?
- Importance of Inferential Statistics
- Probability
- Conditional Probability
- Probability Distribution and Distribution function
- Sampling Distribution
- Central Limit Theorem
- Confidence Interval
- Hypothesis Testing
- Chi-square test
- ANOVA (Analysis of variance)
- Conclusion
- Reference
Introduction
Statistics has a significant part in the field of data science. It helps us in the collection, analysis and representation of data either by visualisation or by numbers into a general understandable format. Generally, we divide statistics into two main branches which are Descriptive Statistics and Inferential Statistics. In this article, we will discuss the Inferential statistics in detail.
Statistics Course for Data Science and Analytics
Learn statistical methods crucial for data science, including regression and hypothesis testing, to extract valuable insights from data.
Population and Sample
Before discussing the Inferential statistics, let us see the population and sample. Population contains all the data points from a set of data. It is a group from where we collect the data. While a sample consists of some observations selected from the population. The sample from the population should be selected such that it has all the characteristics that a population has. Population’s measurable characteristics such as mean, standard deviation etc. are called as parameters while Sample’s measurable characteristic is known as a statistic.
What is Inferential Statistics?
Descriptive statistics describe the important characteristics of data by using mean, median, mode, variance etc. It summarises the data through numbers and graphs.
In Inferential statistics, we make an inference from a sample about the population. The main aim of inferential statistics is to draw some conclusions from the sample and generalise them for the population data. E.g. we have to find the average salary of a data analyst across India. There are two options.
- The first option is to consider the data of data analysts across India and ask them their salaries and take an average.
- The second option is to take a sample of data analysts from the major IT cities in India and take their average and consider that for across India.
The first option is not possible as it is very difficult to collect all the data of data analysts across India. It is time-consuming as well as costly. So, to overcome this issue, we will look into the second option to collect a small sample of salaries of data analysts and take their average as India average. This is the inferential statistics where we make an inference from a sample about the population.
In inferential statistics, we will discuss probability, distributions, and hypothesis testing.
Importance of Inferential Statistics
- Making conclusions from a sample about the population
- To conclude if a sample selected is statistically significant to the whole population or not
- Comparing two models to find which one is more statistically significant as compared to the other.
- In feature selection, whether adding or removing a variable helps in improving the model or not.
Probability
It is a measure of the chance of occurrence of a phenomenon. We will now discuss some terms which are very important in probability:
- Random Experiment: Random experiment or statistical experiment is an experiment in which all the possible outcomes of the experiments are already known. The experiment can be repeated numerous times under identical or similar conditions.
- Sample space: Sample space of a random experiment is the collection or set of all the possible outcomes of a random experiment.
- Event: A subset of sample space is called an event.
- Trial: Trial refers to a special type of experiment in which we have two types of possible outcomes: success or failure with varying Success probability.
- Random Variable: A variable whose value is subject to variations due to randomness is called a random variable. A random variable is of two types: Discrete and Continuous variable. In a mathematical way, we can say that a real-valued function X: S -> R is called a random variable where S is probability space and R is a set of real numbers.
Conditional Probability
Conditional probability is the probability of a particular event Y, given a certain condition which has already occurred , i.e., X. Then conditional probability, P(Y|X) is defined as,
P(Y|X) = N(X∩Y) / N(X); provide N(X) > 0
N(X): - Total cases favourable to the event X
N(X∩Y): - Total favourable simultaneous
Or, we can write as:
P(Y|X) = P(X∩Y) / P(X); P(X) > 0
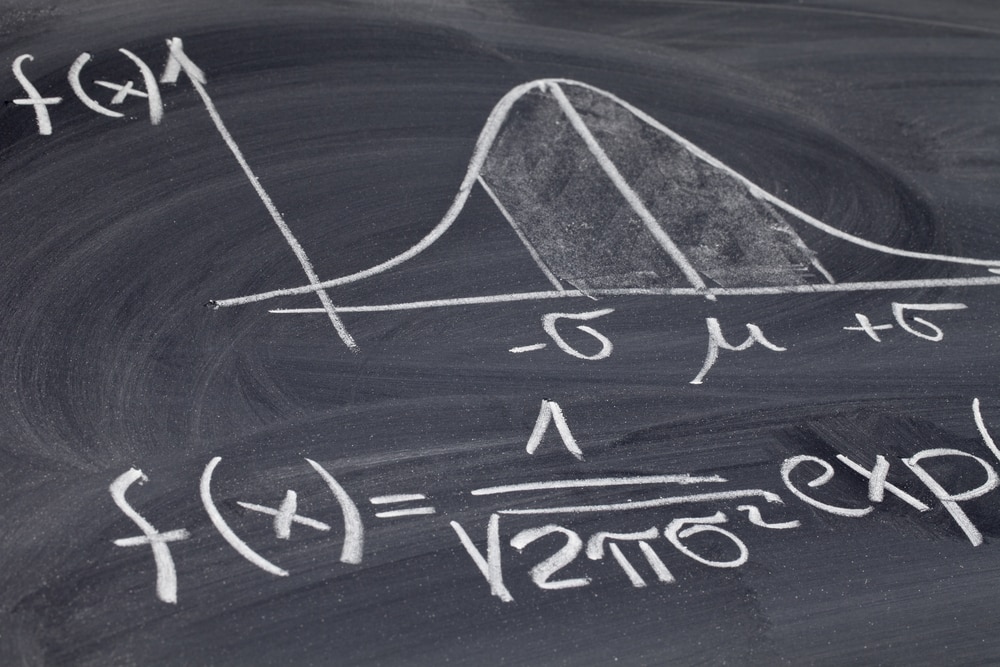
Probability Distribution and Distribution function
The mathematical function describing the randomness of a random variable is called probability distribution. It is a depiction of all possible outcomes of a random variable and their associated probabilities
For a random variable X, CDF (Cumulative Distribution function) is defined as:
F(x) = P {s ε S; X(s) ≤ x}
Or,
F(x) = P {X ≤ x}
E.g. P (X > 7) = 1- P (X ≤ 7)
= 1- {P (X = 1) + P (X = 2) + P (X = 3) + P (X = 4) + P (X = 5) + P (X = 6) + P (X = 7)}
Sampling Distribution
Probability distribution of statistics of a large number of samples selected from the population is called sampling distribution. When we increase the size of sample, sample mean becomes more normally distributed around population mean. The variability of the sample decreases as we increase sample size.
Central Limit Theorem
CLT tells that when we increase the sample size, the distribution of sample means becomes normally distributed as the sample, whatever be the population distribution shape. This theorem is particularly true when we have a sample of size greater than 30. The conclusion is that if we take a greater number of samples and particularly of large sizes, the distribution of sample means in a graph will look like to follow the normal distribution.
In the above graph we can see that when we increase the value of n i.e. sample size, it is approaching the shape of normal distribution.
Confidence Interval
Confidence Interval is an interval of reasonable values for our parameters. Confidence intervals are used to give an interval estimation for our parameter of interest.
The margin of error is found by multiplying the standard error of the mean and the z-score.
Margin of error = (z. σ)/ √n
And Confidence interval is defined as:
Confidence interval having a value of 95% indicates that we are 95% sure that the actual mean is within our confidence interval.
Hypothesis Testing
Hypothesis testing is a part of statistics in which we make assumptions about the population parameter. So, hypothesis testing mentions a proper procedure by analysing a random sample of the population to accept or reject the assumption.
Type of Hypothesis
A hypothesis is of two types:
- Null hypothesis: Null hypothesis is a type of hypothesis in which we assume that the sample observations are purely by chance. It is denoted by H0.
- Alternate hypothesis: The alternate hypothesis is a hypothesis in which we assume that sample observations are not by chance. They are affected by some non-random situation. An alternate hypothesis is denoted by H1 or Ha.
Steps of Hypothesis Testing
The process to determine whether to reject a null hypothesis or to fail to reject the null hypothesis, based on sample data is called hypothesis testing. It consists of four steps:
- Define the null and alternate hypothesis
- Define an analysis plan to find how to use sample data to estimate the null hypothesis
- Do some analysis on the sample data to create a single number called ‘test statistic’
- Understand the result by applying the decision rule to check whether the Null hypothesis is true or not
If the value of t-stat is less than the significance level we will reject the null hypothesis, otherwise, we will fail to reject the null hypothesis.
Technically, we never accept the null hypothesis, we say that either we fail to reject or we reject the null hypothesis.
Terms in Hypothesis testing
Significance level
The significance level is defined as the probability of the case when we reject the null hypothesis but in actual it is true. E.g., a 0.05 significance level indicates that there is 5% risk in assuming that there is some difference when in actual there is no difference. It is denoted by alpha (α).
The above figure shows that the two shaded regions are equidistant from the null hypothesis, each having a probability of 0.025 and a total of 0.05 which is our significance level. The shaded region in case of a two-tailed test is called critical region.
P-value
The p-value is defined as the probability of seeing a t-statistic as extreme as the calculated value if the null hypothesis value is true. Low enough p-value is ground for rejecting the null hypothesis. We reject the null hypothesis if the p-value is less than the significance level.
Errors in hypothesis testing
We have explained what is hypothesis testing and the steps to do the testing. Now during performing the hypothesis testing, there might be some errors.
We classify these errors in two categories.
- Type-1 error: Type 1 error is the case when we reject the null hypothesis but in actual it was true. The probability of having a Type-1 error is called significance level alpha(α).
- Type-2 error: Type 2 error is the case when we fail to reject the null hypothesis but actually it is false. The probability of having a type-2 error is called beta(β).
Therefore,
α= P (Null hypothesis rejected | Null hypothesis is true)
β= P (Null hypothesis accepted | Null hypothesis is false)
Power of test is defined as
P= 1- Type-2 error
= 1 - β
Lesser the type-2 error more the power of the hypothesis test.
| Decision --> / Actual | Reject the null hypothesis | Fail to reject the null hypothesis |
| Null Hypothesis is True | Type-1 Error | Decision is correct |
| Alternate hypothesis is true | Decision is correct | Type-2 Error |
Z-test
A Z-test is mainly used when the data is normally distributed. We find the Z-statistic of the sample means and calculate the z-score. Z-score is given by the formula,
Z-score = (x - µ) / σ
Z-test is mainly used when the population mean and standard deviation are given.
T-test
The t-test is similar to z-test. The only difference is that it is used when we have sample standard deviation but don’t have population standard, or have a small sample size (n<30).
Different types of T-test
One Sample T-test
The one-sample t-test compares the mean of sample data to a known value like if we have to compare the mean of sample data to the population mean we use the One-Sample T-test.
We can run a one-sample T-test when we do not have the population S.D. or we have a sample of size less than 30.
Two sample T-test
We use a two-sample T-test when we want to evaluate whether the mean of the two samples is different or not. In two-sample T-test we have another two categories:
- Independent Sample T-test: Independent sample means that the two different samples should be selected from two completely different populations. In other words, we can say that one population should not be dependent on the other population.
- Paired T-test: If our samples are connected in some way, we have to use paired t-test. Here connecting means thatThe samples are connected as we are collecting data from the same group two times e.g. blood test of patients of a hospital before and after medication.
Chi-square test
Chi-square test is used in the case when we have to compare categorical data. Chi-square test is of two types. Both use chi-square statistics and distribution for different purposes.
- Goodness of fit: It determines if sample data of categorical variables matches with population or not.
- Test of Independence: It compares two categorical variables to find whether they are related with each other or not.
Chi-square statistic is given by:
ANOVA (Analysis of variance)
ANOVA test is a way to find out if an experiment results are significant or not. It is generally used when there are more than 2 groups and we have to test the hypothesis that the mean of multiple populations and variances of multiple populations are equal.
E.g. Students from different colleges take the same exam. We want to see if one college outperforms others.
There are two types of ANOVA test:
- One-way ANOVA
- Two-way ANOVA
The test statistic in Anova is given by:
Conclusion
In this article, we studied inferential statistics and the different topics in it like probability, hypothesis testing, and different types of tests in hypothesis. Also, we discussed the importance of inferential statistics and how we can make inference about the population by sample data which in turn is time-consuming and cost-saving.
Reference
- PROBABILITY AND MATHEMATICAL STATISTICS by Prasanna Sahoo Department of Mathematics University of Louisville, KY 40292 USA
- FUNDAMENTALS OF MATHEMATICAL STATISTICS by S.C. GUPTA V.K. KAPOOR
- An Introduction to the Science of Statistics: From Theory to Implementation Preliminary Edition Joseph C. Watkins
If you wish to pursue a career in data science, upskill with Great Learning's PG program in Data Science.