
Microsoft Excel is widely used across organizations for managing data, performing analysis, and creating reports.
However, relying on manual data entry and repetitive spreadsheet tasks often leads to wasted time, errors, and inefficient workflows. As data volumes grow, these challenges become even more significant.
Python provides a reliable and efficient solution for Excel automation. With specialized Python libraries, professionals can process large datasets, apply complex logic, and generate accurate reports with minimal manual effort.
This blog explores how to automate Excel with Python, highlighting practical methods that convert time-consuming manual tasks into consistent, scalable automated workflows.
Configuring Your Development Environment
Before writing any automation code, it is essential to set up the Python environment with the required libraries.
Python follows a modular approach, meaning different libraries are used to handle specific aspects of Excel files, such as:
- Reading Data
- Writing Worksheets
- Applying Formatting
Installing the right dependencies ensures that Excel automation tasks run smoothly and efficiently.
To install these essential libraries, you need to execute the following command in your terminal or command prompt:
pip install pandas openpyxl xlsxwriter xlwings
Creating a Practice File
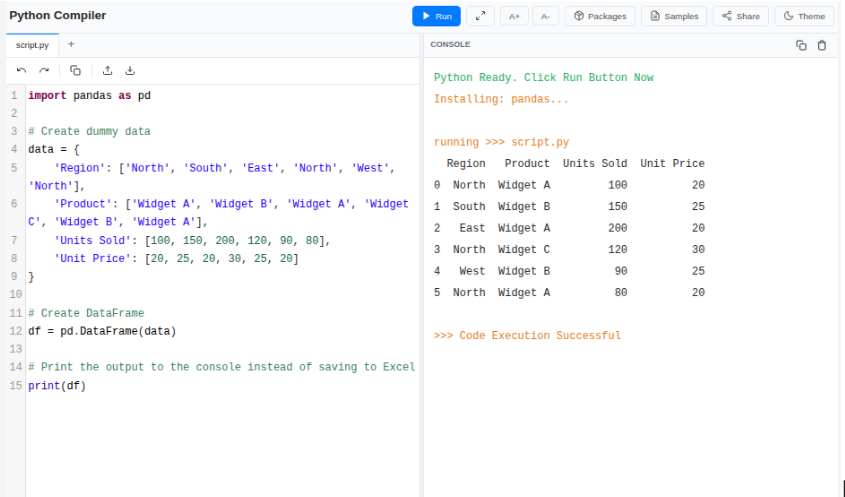
To follow along with this guide, run this quick script first. It will generate a file named sales_data.xlsx with the data required for the examples below.
import pandas as pd

# Create dummy data

data = {

    'Region': ['North', 'South', 'East', 'North', 'West', 'North'],

    'Product': ['Widget A', 'Widget B', 'Widget A', 'Widget C', 'Widget B', 'Widget A'],

    'Units Sold': [100, 150, 200, 120, 90, 80],

    'Unit Price': [20, 25, 20, 30, 25, 20]

}

# Create DataFrame

df = pd.DataFrame(data)

# Print the output to the console instead of saving to Excel

print(df)
It is important to understand the distinct role each library plays in the automation process:
- Pandas: Pandas is the primary library for data analysis in Python. Pandas cleans, analyzes, and organizes data into structured formats called DataFrames, making data easier to process and analyze. Pandas handles complex calculations efficiently, allowing users to work with large datasets without manual effort.
- Openpyxl: Openpyxl is a widely used library for working with Excel .xlsx files (Excel 2010 and later). It allows users to read, create, and modify Excel files, making it ideal for updating existing spreadsheets or applying specific changes.
- XlsxWriter: XlsxWriter is designed specifically for creating new Excel files. It supports advanced formatting and chart creation, but does not allow reading or editing of existing Excel files.
- Xlwings: Xlwings enables direct interaction with a live Excel application. It is commonly used as an alternative to VBA macros when real-time control and automation within Excel are required.
Technique 1: Data Manipulation with Pandas
One of the most common uses of Excel automation is handling data-related tasks, such as data cleaning, transformation, and reorganization.
Pandas is well-suited for this purpose as it works with Excel data in a structured, table-like format. This enables users to efficiently:
- Filter Records,
- Perform Aggregations
- Create Pivot-Style Summaries Using Concise & Readable Python Code
Reading and Cleaning Data Sets
The process begins by loading your Excel file into a Pandas DataFrame. This object allows you to perform operations on the entire dataset simultaneously rather than iterating through cells one by one.
import pandas as pd

# Load the Excel file into a DataFrame

file_path = 'sales_data.xlsx'

df = pd.read_excel(file_path)

# Data Cleaning: Eliminate rows that contain missing values

df_clean = df.dropna()

# Filtering: Isolate sales records specifically from the 'North' region

north_sales = df_clean[df_clean['Region'] == 'North'].copy()

# Calculation: Create a 'Total Revenue' column by multiplying units by price

north_sales['Total Revenue'] = north_sales['Units Sold'] * north_sales['Unit Price']

# Display the first few rows to verify the data

print(north_sales.head())
This script eliminates the need for hours of manual filtering and formula work.
Pandas is the backbone of Excel automation with Python. If you want to master data cleaning, aggregation, and automation at scale, enrolling in a Python Programming Course can significantly accelerate your learning curve and make you job-ready for data-driven roles.
In this course, you will learn the fundamentals of Python: from basic syntax to mastering data structures, loops, and functions. You will also explore OOP concepts and objects to build robust programs.
Aggregating Data with Pivot Tables
Excel users commonly use Pivot Tables for data summaries, but these can break when the underlying data format changes. Pandas allows you to create stable, repeatable pivot-style summaries that update automatically as the data changes.
import pandas as pd

# 1. Setup Data (From previous steps)

data = {

    'Region': ['North', 'South', 'East', 'North', 'West', 'North'],

    'Product': ['Widget A', 'Widget B', 'Widget A', 'Widget C', 'Widget B', 'Widget A'],

    'Units Sold': [100, 150, 200, 120, 90, 80],

    'Unit Price': [20, 25, 20, 30, 25, 20]

}

df = pd.DataFrame(data)

# 2. Filter for North Region and Calculate Revenue

df_clean = df.dropna()

north_sales = df_clean[df_clean['Region'] == 'North'].copy()

north_sales['Total Revenue'] = north_sales['Units Sold'] * north_sales['Unit Price']

# --- NEW STEP: Aggregating Data with Pivot Tables ---

# Generate a summary table grouping data by Product and summing the Revenue

summary_table = north_sales.pivot_table(

    index='Product',

    values='Total Revenue',

    aggfunc='sum'

)

# Print the summary table instead of exporting to Excel

print("Summary Table (Total Revenue by Product in North Region):")

print(summary_table)

Technique 2: Formatting and Styling with Openpyxl
Pandas focuses on data processing, not on data visualization. Openpyxl complements this by allowing you to apply professional formatting to Excel reports generated through Python. It is especially useful for improving the appearance and readability of finalized reports.
Key formatting features include:
- Font Customization: Modify font styles, sizes, and emphasis to highlight important information.
- Color Coding: Apply background colors to headers or selected cells to visually separate sections.
- Borders and Alignment: Add borders and adjust text alignment to create a clean and well-structured layout.
Applying Headers and Fonts
A professional report requires a polished appearance. You can programmatically identify header rows and apply specific styles to them.
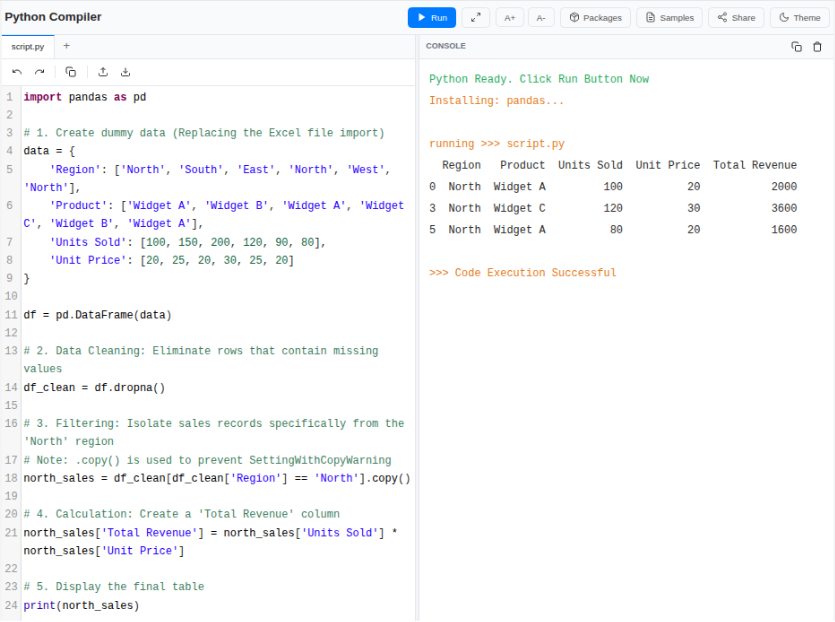
import pandas as pd

# 1. Create dummy data (Replacing the Excel file import)

data = {

    'Region': ['North', 'South', 'East', 'North', 'West', 'North'],

    'Product': ['Widget A', 'Widget B', 'Widget A', 'Widget C', 'Widget B', 'Widget A'],

    'Units Sold': [100, 150, 200, 120, 90, 80],

    'Unit Price': [20, 25, 20, 30, 25, 20]

}

df = pd.DataFrame(data)

# 2. Data Cleaning: Eliminate rows that contain missing values

df_clean = df.dropna()

# 3. Filtering: Isolate sales records specifically from the 'North' region

# Note: .copy() is used to prevent SettingWithCopyWarning

north_sales = df_clean[df_clean['Region'] == 'North'].copy()

# 4. Calculation: Create a 'Total Revenue' column

north_sales['Total Revenue'] = north_sales['Units Sold'] * north_sales['Unit Price']

# 5. Display the final table

print(north_sales)

By separating data logic from visual formatting, this method improves both clarity and efficiency. Pandas manages computational tasks, whereas Openpyxl handles report styling, resulting in a well-structured automation workflow.
Technique 3: Interactive Automation with Xlwings
In scenarios where direct interaction with a live Excel workbook is required, Xlwings provides an effective solution. It also enables the execution or replacement of complex VBA-based workflows using Python by directly controlling the Excel application.
Xlwings is best suited for the following use cases:
- Real-Time Interaction: Reading from and writing to Excel while the workbook remains open and visible to the user.
- Interactive Tools: Allowing users to input parameters in Excel cells while Python performs complex calculations in the background.
- Macro Replacement: Acting as a Python-based alternative to VBA for direct control over the Excel application.
Important Note: Unlike other libraries, Xlwings requires Microsoft Excel to be installed on the machine running the script. It is suitable for local desktop automation, but cannot be used on Linux servers or cloud environments without Excel.
import xlwings as xw

# Establish a connection to the currently active workbook (Ensure Excel is open first)

wb = xw.books.active

sheet = wb.sheets['Input']

# Read a numerical value from cell A1

input_val = sheet.range('A1').value

# Execute a complex calculation using Python

result = input_val * 1.15  # Example calculation logic

# Write the calculated result back to cell B1 instantly

sheet.range('B1').value = result
This feature allows non-technical users to benefit from Python automation while working entirely within the familiar Excel interface, combining ease of use with powerful computational capabilities.
Real-World Scenario: Automated Monthly Reporting
Consider a typical business workflow: you extract raw data from a database, process and refine it, and then share a structured analysis with your team.
Automated Workflow:
- Ingest: A Python script scans a designated folder to locate the latest CSV export.
- Process: Pandas aggregates the data by region and computes year-over-year growth metrics.
- Visualize: XlsxWriter creates a new workbook with a "Summary" tab featuring performance charts and a "Data" tab with detailed records.
By leveraging these libraries together, a task that normally takes four hours manually can be completed in under thirty seconds.
import pandas as pd
# 1. Setup Dummy Data (Replacing the external file)
data = {
'Category': ['Electronics', 'Clothing', 'Electronics', 'Furniture', 'Clothing', 'Electronics', 'Furniture'],
'Sales': [1000, 500, 1200, 800, 600, 1500, 450]
}
def generate_monthly_report():
# Load data from dictionary
df = pd.DataFrame(data)
# 2. Process Data
summary = df.groupby('Category')['Sales'].sum().reset_index()
# PRINT output to console (as requested)
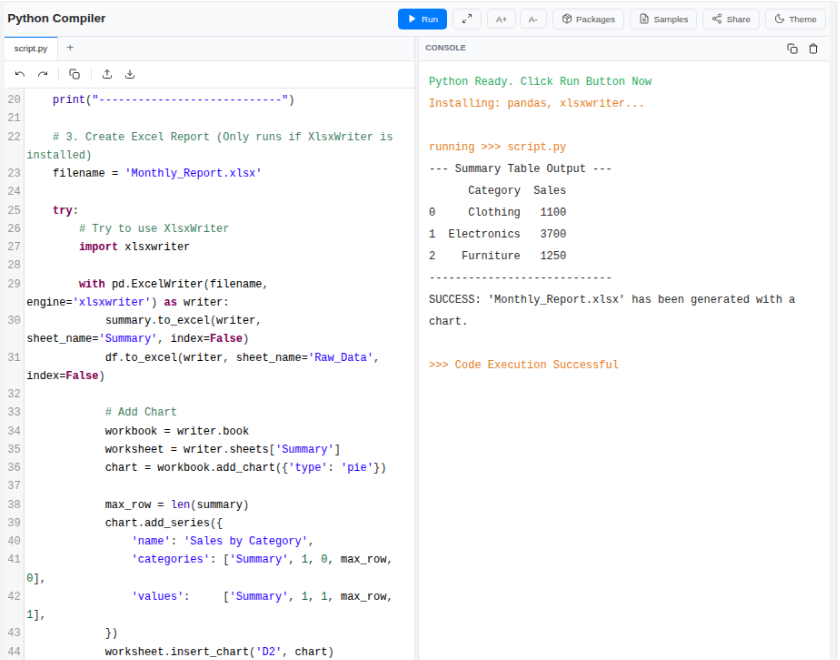
print("--- Summary Table Output ---")
print(summary)
print("----------------------------")
# 3. Create Report with Charts
# Note: XlsxWriter must save to a file to create charts.
filename = 'Monthly_Report.xlsx'
with pd.ExcelWriter(filename, engine='xlsxwriter') as writer:
summary.to_excel(writer, sheet_name='Summary', index=False)
df.to_excel(writer, sheet_name='Raw_Data', index=False)
# Access Workbook and Worksheet
workbook = writer.book
worksheet = writer.sheets['Summary']
# Create Chart
chart = workbook.add_chart({'type': 'pie'})
# Dynamic Row Calculation (Matches the data size automatically)
# We start at row 1 (skipping the header)
max_row = len(summary)
chart.add_series({
'name': 'Sales by Category',
# Syntax: [sheet_name, first_row, first_col, last_row, last_col]
'categories': ['Summary', 1, 0, max_row, 0],
'values': ['Summary', 1, 1, max_row, 1],
})
worksheet.insert_chart('D2', chart)
print(f"File '{filename}' generated successfully with Pie Chart.")
# Run the function
generate_monthly_report()
Best Practices for Building Robust Scripts
- Use Relative Paths: Avoid hardcoding absolute paths. Instead, use Python’s os or pathlib modules to reference files relative to the script’s location. This ensures the automation works correctly even if the project folder is moved or shared.
- Implement Graceful Error Handling: Excel files can be inconsistent, with renamed tabs or unexpected columns. Wrap data-loading code in try...except blocks to catch errors and provide clear, informative messages instead of allowing the script to fail silently.
- Separate Data from Logic: Never embed input data within the script. Always read from external files and write outputs to new files. This preserves the original data as the single source of truth and prevents accidental loss during automation.
Quick Summary: Which Library Should You Use?
| Library | Best Used For | Can Read Files? | Can Write Files? |
| Pandas | Data analysis, filtering, and math | Yes | Yes |
| Openpyxl | Editing existing files and formatting | Yes | Yes |
| Xlwings | Controlling the Excel App and Macros | Yes | Yes |
Conclusion
Automating Excel workflows with Python empowers you to move beyond manual updates. By integrating tools like Pandas for calculations, Openpyxl for styling, and Xlwings for interactive features, you create reliable, scalable solutions that save time and reduce errors.
Automating Excel with Python is powerful but strong spreadsheet fundamentals will make your scripts even more effective. If you want to strengthen your base, our Pro Excel course is a great place to start before advancing into automation techniques.
By integrating tools like Pandas for calculations, Openpyxl for styling, and Xlwings for interactive features, you create reliable, scalable solutions that save time and reduce errors. If you want to strengthen your foundational Excel skills before applying these techniques, this Free Excel course is a great place to start.


