Anyone who has worked with Excel for a while knows how difficult it is to prepare data properly. Spending hours fixing and organizing your data is often necessary before starting the analysis. Getting the data ready is essential, though most people don’t enjoy it much.
Power Query is included in Excel and is designed to make it easier and faster to deal with your data. You can pull data from several sources, clean it to your liking, and insert it into your workbook without coding, except if you wish to try out the special M language.
In this article, we’ll explain what Power Query does, why so many Excel users rely on it, and how you can use it even if you're not a tech expert. If you're looking for a faster, more reliable way to handle data in Excel, Power Query is well worth exploring.
If you're new to Excel or looking to strengthen your foundational skills before diving into Power Query, consider enrolling in this free course:
Learn Excel the smart way! Our course teaches you all the essential tools and techniques to master spreadsheets, from formulas to charts, and improve your workflow in every task you do.
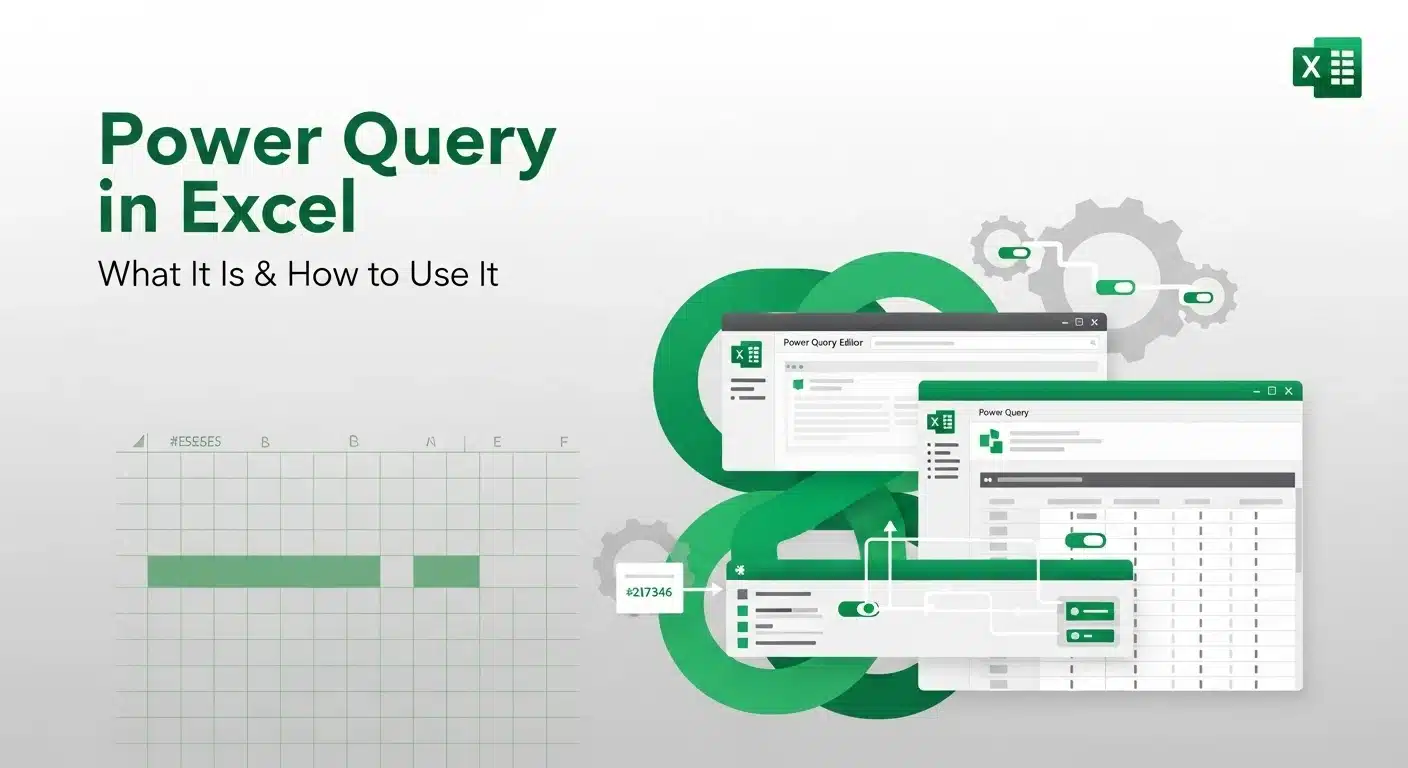
What is a Power Query?
Power Query is a feature in Excel that makes it possible to get data from different sources, clean it, and arrange it the way you want without repeating the process manually.
This is Microsoft’s solution to the frequent problem of repeatedly handling the same data job. Power Query allows you to set up the process once, but the output will update automatically each time your data is refreshed.
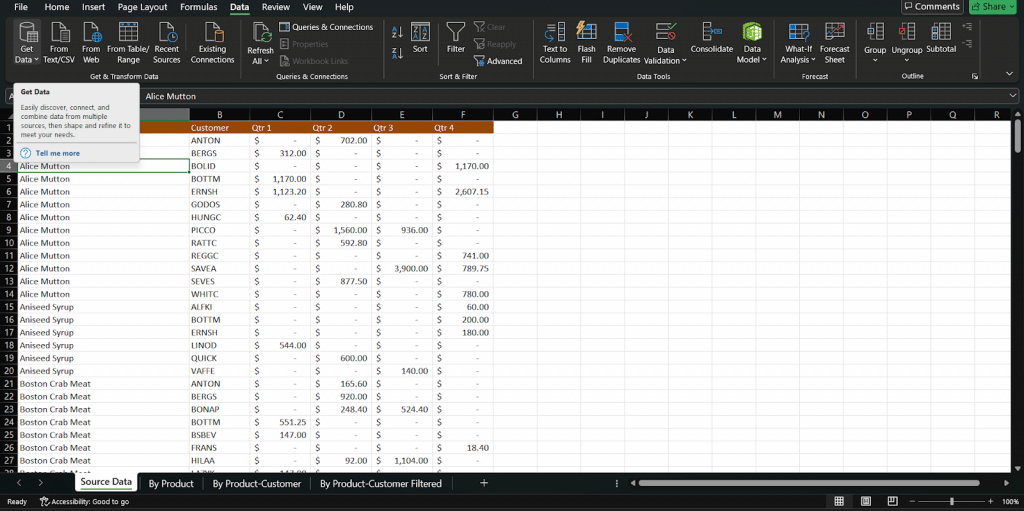
From Excel 2016 onwards, Power Query is included in the application under the “Get & Transform” section of the Data tab. If you have Excel 2010 or 2013, you can download a free add-in to use the tool.
Power Query works by following the steps of Extract, Transform, Load. This allows you to get information from files (Excel, CSV), databases, or web pages, change it as required, and insert it into your Excel spreadsheet or data model.
Among its main advantages are being automated and flexible. It can perform basic actions such as deleting blanks or combining information from multiple databases.
The best thing is that coding skills are not required, but advanced users may use the included M language to take more charge of their data.
Why Use Power Query?
If you struggle with cleaning your data every week or worse, every day, Power Query may be precisely what you need. You save a lot of time by using it because it handles all those repetitive jobs for you, so you don’t have to remain stuck copying, pasting, filtering and fixing.
Because Power Query records each step as you make changes, your process becomes repeatable. You only have to set it up once; from then on, you can refresh the data with a single click. That not only saves time but also cuts down on human error.
You’re less likely to miss a column, apply the wrong filter, or forget a step, especially when in a rush.
Another benefit is that it keeps everything in one place. Instead of juggling multiple spreadsheets or doing bits of cleanup here and there, Power Query lets you centralize your entire data-cleaning workflow inside Excel.
It works smoothly with other tools developed by Microsoft. Since Power BI uses Power Query, you can work with it similarly. Because Query supports Excel, CSV, databases, and cloud services, it fits nicely into nearly any set of tasks.
It works smoothly with other Microsoft tools, especially Power BI, which uses Power Query for data transformation and modeling. If you want to take your data preparation skills further and learn how to build dashboards from that data, you can explore this Free Power BI course to understand how Excel and Power BI work together for analytics.
Free Data Visualization Power BI Course
Learn how to create interactive visualizations, understand their role in decision-making, and master Power BI’s core features in this course.
Key Features of Power Query
What sets Power Query apart is that it comes with so many helpful tools, and this is in a program that everyone finds easy to learn.
Data Connectivity
You can pull data from various sources: Excel files, CSVs, databases like SQL Server, SharePoint folders, websites, and even APIs. No more copy-pasting between files.
User-Friendly Query Editor
The Power Query interface is built with non-coders in mind. It's point-and-click, drag-and-drop easy to use even if you've never worked with data tools before.
Steps Pane
As you make changes (like removing columns, filtering rows, or renaming headers), each step is automatically recorded. This means your process is fully traceable and editable at any time.
Applied Steps List
You can view and manage every transformation you've applied in a clear, ordered list. If something goes wrong, it’s easy to go back, adjust, or remove a step.
M Language (Advanced Use)
Even though coding is not required with Power Query, the M language powers its processing. Those who prefer to program can make changes and write scripts for more dynamic logic.
Flexible Load Options
Once your data is ready, you can choose to load it directly into an Excel worksheet or the data model (useful for pivot tables or Power BI integration).
How to Use Power Query – Step-by-Step Guide
Step 1: Open Power Query
Start by heading to the Data tab in Excel. Under the Get & Transform Data section, you’ll see options like Get Data, From Workbook, From Text/CSV, and more. This is where Power Query lives.

Click on the option that matches your data source.

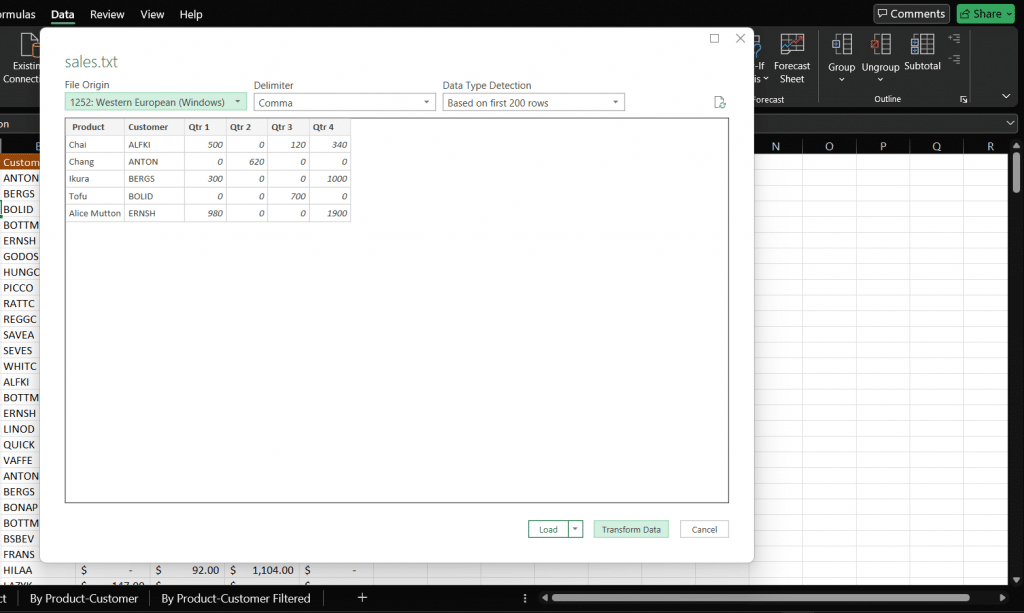
Step 2: Connect to a Data Source
Let’s say you’re importing a CSV file. Click Get Data > From File > From Text/CSV, then browse and select your file. Power Query will preview the contents before loading anything. If it looks good, hit Transform Data to open the full Query Editor.
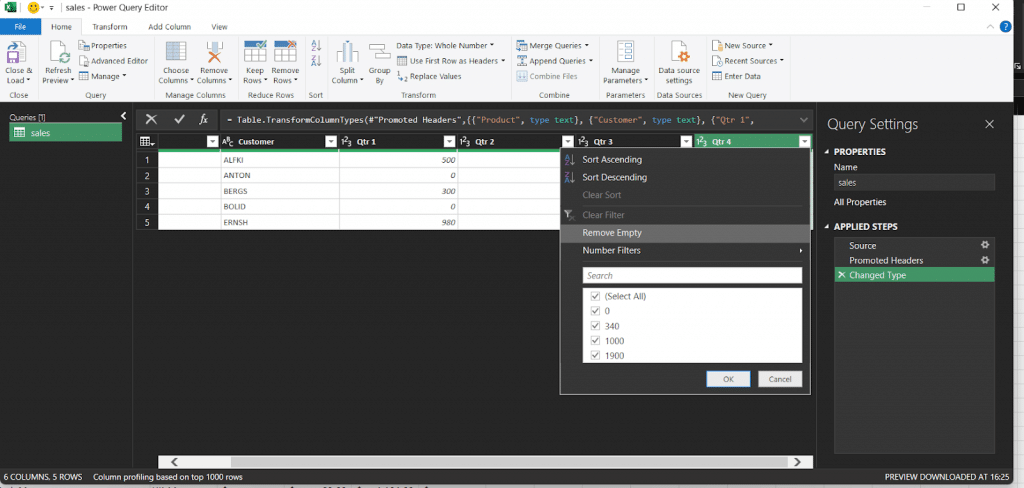
Step 3: Transform the Data
Inside the Power Query Editor, you can clean up your data using simple tools:
- Remove unnecessary columns
- Change data types (e.g., turn text into numbers)
- Filter out rows you don’t need
- Rename columns for clarity


All these actions are recorded step-by-step, so you don’t have to redo them later.
Step 4: Combine Data (Optional but Powerful)
If you’re working with multiple files or tables, you can:
- Merge Queries to join tables side by side (like VLOOKUP)
- Append Queries to stack data from different sources on top of each other
This is especially useful for consolidating monthly reports or tracking data over time.
Step 5: Load the Data
Once everything looks the way you want it, click Close & Load. You can choose to load it directly into a worksheet or send it to the data model for more advanced analysis.
Bonus Tip: Refreshing Data
Here’s the best part: if your source file gets updated, just hit Refresh in Excel. Power Query will re-run all your steps automatically, saving you tons of time.
With just a little setup, Power Query can transform how you handle data in Excel. You don’t need to be a tech expert; just curiosity and a few clicks go a long way.
Want guided practice with real data? This premium course on Data Analytics in Excel walks you through practical examples to help you apply what you've learned inside Excel.
Learn Excel for powerful data analysis and enhance your skills for better decision-making.
Real-Life Use Cases
Power Query isn’t just for data pros, it’s a practical tool that solves everyday Excel headaches. Here are a few ways it’s used in real-world situations:
Monthly Sales Reports
Instead of manually updating your monthly report, you can set up a Power Query that pulls in the latest data from your sales file. With one click, everything refreshes totals, charts, and all.
Cleaning Messy CSV Exports
Many systems export reports as CSV files, but often come with weird formatting, extra rows, or inconsistent column names. Power Query lets you clean them up instantly, remove unnecessary columns, fix headers, and reformat dates, all in one go.
Consolidating Excel Sheets
Combining multiple reports from different teams into one table is very easy using Power Query. This work does not need copy-pasting.
Transforming Web Data
Need up-to-date currency rates, stock prices, or fuel costs? Power Query can connect with websites or APIs, tidy up your data, and refresh it as you update your spreadsheet.
In other words, if you always run the same steps again and again in Excel, Power Query can likely handle this for you, in less time and more reliably.
After preparing and transforming your data with Power Query, presenting it effectively is crucial. This free course on Excel dashboards guides you through creating impactful visualizations for business analytics.
Common Pitfalls & Tips
Even though Power Query is user-friendly, there are a few things to watch out for:
- Avoid hardcoding values – If your query depends on something like a date or file path, consider using parameters. It makes your setup more flexible and easier to update later.
- Always check data types – Power Query might guess the wrong data type (e.g., treating numbers as text), which can break formulas or calculations down the line.
- Don’t mix manual steps with automated ones – Try to do as much cleaning and shaping inside Power Query as possible. Making changes afterward in Excel can cause confusion or errors when refreshing.
- Name your queries clearly – Instead of leaving them as “Query1” or “Sheet1 (2),” use names like “CleanedSalesData” or “Merged_Regions” so you know what’s what later.
Power Query helps automate the repetitive parts of data handling, but combining it with basic Excel shortcuts can make your entire workflow much faster.
If you want to speed things up even more, check out this list of commonly used Excel shortcuts to keep your work efficient and keyboard-friendly.
Conclusion
Power Query is one of Excel’s most underrated tools. It takes the repetitive, messy parts of working with data and turns them into smooth, automated steps that you can reuse repeatedly.
Power Query can help you merge files, clean up export files, and prepare data for analysis, all in less time and with fewer errors. You can easily use AI without being a specialist in data analysis. Anyone from beginners to analysts can benefit from what it offers.
The best way to learn? Start experimenting. Open Power Query, connect to some sample data, and try things out. You’ll be surprised how much time it can save once you get the hang of it.
If you're ready to explore more of what Excel can do beyond Power Query, consider taking a complete Excel course for beginners to advanced users that covers formulas, dashboards, and advanced analytics techniques.