The preparation required to crack a Machine Learning interview is quite challenging as they check in hard on technical and programming skills, and general ML concepts. If you are an aspiring Machine Learning professional, it is crucial to know what kind of Machine Learning interview questions hiring managers may ask.
To help you streamline this learning journey, we have narrowed down these essential ML questions for you. With these questions, you will be able to land jobs as Machine Learning Engineer, Data Scientist, Computational Linguist, Software Developer, Business Intelligence (BI) Developer, Natural Language Processing (NLP) Scientist & more.
So, are you ready to have your dream career in ML?
Table of Content
- Basic Level Machine Learning Interview Questions
- Intermediate Level Machine Learning Interview Questions and Answers
- Top 10 frequently asked Machine learning Interview Questions
- Conclusion
- Machine Learning Interview Questions FAQ’s
Introduction
A Machine Learning interview is a challenging process where candidates are tested on their technical skills, programming abilities, understanding of ML methods, and basic concepts. If you want to build a career in Machine Learning, it’s important to prepare well for the types of questions recruiters and hiring managers commonly ask.
Basic Level Machine Learning Interview Questions
1. What is Machine Learning?
Machine Learning (ML) is a subset of Artificial Intelligence (AI) in which the algorithms are created, so that computers can learn, and make decisions without being explicitly programmed. It uses data to identify patterns and make predictions. For example, an ML algorithm could predict customer behaviour based on past data without being specifically programmed to do so.
2. What are the different types of Machine Learning?
Machine learning can be categorized into three main types based on how the model learns from data:
- Supervised Learning: Involves training a model using labelled data, where the output is known. The model learns from the input-output pairs and makes prediction for unseen data.
- Unsupervised Learning: Involves training a model using unlabeled data, where the system tries to find hidden patterns or groupings in the data.
- Reinforcement Learning: Involves training an agent to make sequences of decisions by interacting with an environment, receiving feedback in the form of rewards or penalties, and learning to maximize cumulative rewards over time.
To learn more about the types of Machine Learning in detail, explore our comprehensive guide on Machine Learning and its types?
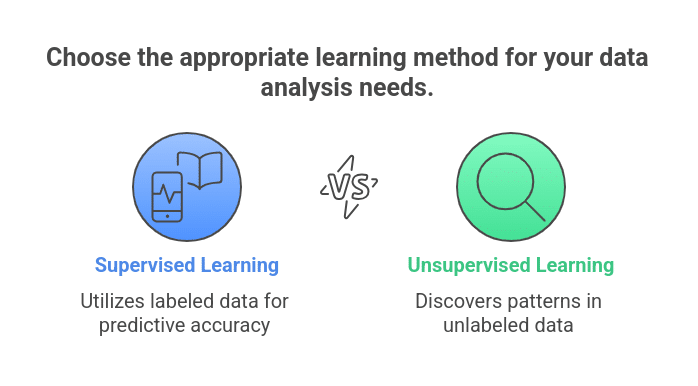
3. What is the difference between Supervised and Unsupervised Learning?
- Supervised Learning: The model is trained on labelled data. Each training example includes an input and its corresponding correct output. The model’s task is to learn the mapping between the input and output.
- Example: Classifying the emails as spam or not spam.
- Unsupervised Learning: The model is given unlabeled data and must find hidden structures or patterns in the data. No explicit output is provided.
- Example: Clustering customers into different segments based on purchasing behaviour.
4. What is overfitting in Machine Learning?
Overfitting happens when a model learns both the actual patterns and the random noise in the training data. This makes it perform well on the training data but poorly on new, unseen data. Methods like L1/L2 regularization and cross-validation are commonly used to avoid overfitting.
5. What is underfitting in Machine Learning?
If a model is too simple to understand the patterns in the data, it’s underfitting. This usually occurs if the model has too few features or is not complex enough. The model’s poor performance is a consequence of its poor performance on the training and test data.
6. What is Cross-Validation?
Cross-validation is a method to check how well a machine learning model works. The data is divided into smaller groups called “folds.” The model is trained on some folds and tested on others, and this is repeated for each fold. The results from all the folds are averaged to give a more reliable measure of the model’s performance.
7. Explain the difference between Classification and Regression.
- Classification: In classification problems, the aim is to predict a discrete label or category. The output is categorical, and models are used to assign the input data to one of these categories.
- Example: Predicting whether an email is spam or not.
- Regression: In regression problems, the aim is to predict a continuous value. The output is a real number, and models are used to estimate this value.
- Example: Predicting the price of a house based on its features like size and location.
8. What is a Confusion Matrix?
A confusion matrix is a table used to evaluate how good a classification model is. The number of true positives, false positives, true negatives and false negatives is shown, useful for calculating performance metrics such as accuracy, precision, recall, and F1-score.
- True Positive (TP): The positive class is correctly predicted by the model.
- False Positive (FP): The model fails to predict the positive class.
- True Negative (TN): The model predicts the negative class correctly.
- False Negative (FN): The model gives the wrong answer to a negative class.
9. What is an Activation Function in Neural Networks?
An activation function is a mathematical function applied to the output of a neuron in a neural network. It determines whether a neuron should be activated (i.e., fired) based on the weighted sum of its inputs. Common activation functions include:
- Sigmoid: Maps input to a value between 0 and 1.
- ReLU (Rectified Linear Unit): Outputs 0 for negative inputs and the input itself for positive inputs.
- Tanh: Maps input to values between -1 and 1.
10. What is Regularization in Machine Learning?
Regularization helps prevent overfitting by penalizing the loss function. The penalty discourages the model from fitting too closely to the noise in the training data. Common types of regularization include:
- L1 regularization (Lasso): Adds the absolute values of the weights as a penalty term.
- L2 regularization (Ridge): Adds the squared values of the weights as a penalty term.
11. What is Feature Scaling?
Feature scaling refers to the process of normalizing or standardizing the range of features in a dataset. This is essential when using algorithms that are sensitive to the scale of the data (e.g., gradient descent-based algorithms). Common methods include:
- Normalization: Rescaling features to a range between 0 and 1.
- Standardization: Rescaling features so they have a mean of 0 and a standard deviation of 1.
12. What is Gradient Descent?
Gradient Descent is an optimization technique used to minimize the loss function in machine learning models. The model’s parameters are updated with the negative gradient of the loss function. This update uses the learning rate to control how big the steps are. Variants include:
- Batch Gradient Descent: Uses the entire dataset to compute the gradient.
- Stochastic Gradient Descent (SGD): Uses one data point at a time to update the parameters.
- Mini-Batch Gradient Descent: Uses a small subset of the data for each update.
13. What is a Hyperparameter?
A hyperparameter is a variable that is set before learning starts. Hyperparameters control the training process and the model’s architecture, such as the learning rate, the number of layers in a neural network, or the number of trees in a Random Forest.
14. What is a Training Dataset?
A training dataset is the data set used to train a machine learning model. It contains both the input features and the corresponding labels (in supervised learning). The model learns from this data by adjusting its parameters to minimize the error between its predictions and the actual labels.
15. What is K-Nearest Neighbors (KNN)?
K-Nearest Neighbors (KNN) is a simple, instance-based learning algorithm. In KNN, the class of a data point is determined by the majority class of its k nearest neighbours. The “distance” between points is typically measured using Euclidean distance. KNN is a non-parametric algorithm, meaning it doesn’t assume any underlying distribution of the data.
Intermediate Level Machine Learning Interview Questions and Answers
1. What is Dimensionality Reduction?
Dimensionality Reduction is the way of reducing the number of features (dimensions) in a dataset while retaining as much information as possible. It simplifies data visualization, reduces computational cost, and mitigates the curse of dimensionality. Popular techniques include:
- Principal Component Analysis (PCA): Transforms features into uncorrelated components ranked by explained variance.
- t-SNE: A visualization technique to map high-dimensional data into two or three dimensions.
2. What is Principal Component Analysis (PCA)?
PCA is a technique used for Dimensionality Reduction. It works by:
- Standardizing the dataset to have a mean of zero and unit variance.
- Calculating the covariance matrix of the features.
- Identifying principal components by deriving eigenvalues and eigenvectors of the covariance matrix.
- Projecting data onto the top principal components to reduce dimensions while retaining maximum variance.
3. What is the Curse of Dimensionality?
The Curse of Dimensionality means that working with high-dimensional data is challenging. As dimensions increase:
- Data becomes sparse, making clustering and classification difficult.
- Distance metrics lose significance.
- Computational complexity grows exponentially. Dimensionality Reduction helps mitigate these issues.
4. What is Cross-Validation, and why is it important?
Cross-validation is a technique to assess model performance by dividing data into training and validation sets. The most common method is k-fold cross-validation:
- The data is split into k subsets (folds).
- The model is sequentially trained on a k-1 fold and validated on one fold. This ensures the model generalizes well to unseen data and avoids overfitting or underfitting.
5. Explain Support Vector Machines (SVM).
Support Vector Machine (SVM) is a supervised learning algorithm that supports classification and regression. It works by:
- Maximizing the margin between different classes by finding a hyperplane.
- Using kernel functions (e.g., linear, polynomial, RBF) to handle non-linear data. SVM is effective in high-dimensional spaces and is robust against overfitting, especially in smaller datasets.
6. What is the Difference Between Bagging and Boosting?
- Bagging (Bootstrap Aggregating): Reduces variance by training multiple models on different bootstrapped datasets and averaging their predictions. Example: Random Forest.
- Boosting reduces bias by sequentially training models, each focusing on correcting the errors of its predecessor. An example Is Gradient-Boosting Machines.
7. What is ROC-AUC?
The ROC (Receiver Operating Characteristic) curve plots the True Positive Rate (TPR) against the False Positive Rate (FPR) at various thresholds. The Area Under the Curve (AUC) measures the model’s ability to distinguish between classes. A model with an AUC of 1 is perfect, while 0.5 indicates random guessing.
8. What is Data Leakage?
Data Leakage occurs when information from the test set is used during training, leading to overly optimistic performance estimates. Common causes include:
- Including target information in predictors.
- Improper feature engineering based on the entire dataset. Prevent leakage by isolating test data and strictly separating data preprocessing pipelines.
9. What is Batch Normalization?
Batch Normalization is a technique to improve deep learning model training by normalizing the inputs of each layer:
- It standardizes activations to have zero mean and unit variance within each mini-batch.
- It reduces internal covariate shifts, stabilizes training, and allows higher learning rates.
10. What are Decision Trees, and How Do They Work?
Decision Trees are supervised learning algorithms used for classification and regression. They split data recursively based on feature thresholds to minimize impurity (e.g., Gini Index, Entropy). Pros:
- Easy to interpret.
- Handles non-linear relationships. Cons:
- Prone to overfitting (addressed by pruning or using ensemble methods).
11. What is Clustering, and Name Some Techniques?
An unsupervised learning technique for grouping similar data points is called clustering. Popular methods include:
- K-Means Clustering: Assigns data points to k clusters based on proximity to centroids.
- Hierarchical Clustering: Builds a dendrogram to group data hierarchically.
- DBSCAN: Groups based on density, identifying clusters of varying shapes and noise.
12. What is the Purpose of Feature Selection?
Feature Selection identifies the most relevant predictors to:
- Improve model performance.
- Reduce overfitting.
- Lower computational cost. Techniques include:
- Filter Methods: Correlation, Chi-Square.
- Wrapper Methods: Recursive Feature Elimination (RFE).
- Embedded Methods: Feature importance from models like Random Forest.
13. What is the Grid Search Method?
Grid Search is a hyperparameter tuning method. It tests all possible combinations of hyperparameters to find the optimal set for model performance. For example, in an SVM:
- Search over kernels: Linear, Polynomial, RBF.
- Search over C values: {0.1, 1, 10}. Though computationally expensive, it ensures systematic exploration of hyperparameters.
Top 10 frequently asked Machine learning Interview Questions.
1. Explain the terms Artificial Intelligence (AI), Machine Learning (ML), and Deep Learning.
The domain of producing intelligent machines is called Artificial Intelligence (AI). System ML is a system that can learn from experience (training data) on large data sets, and systems DL are systems that learn from experience on large data sets. AI is a subset of ML. ML is Deep Learning (DL) but is used for large data sets.
In short, DL was a subset of ML & ML was a subset of AI.
Additional Information: AI includes ASR (Automatic Speech Recognition) & NLP (Natural Language Processing) and overlays with ML & DL, as ML is often used in NLP and ASR tasks.
2. What are the different types of Learning/Training models in ML?
ML algorithms can be primarily classified depending on the presence/absence of target variables.
A. Supervised learning: [Target is present]
The machine learns using labelled data. The model is trained on an existing data set before it starts making decisions with the new data.
The target variables are continuous linear regression, polynomial regression, and quadratic regression.
The target variable is categorical: Logistic regression, Naive Bayes, KNN, SVM, Decision Tree, Gradient Boosting, ADA boosting, Bagging, Random forest, etc.
B. Unsupervised learning: [Target is absent]
The machine is trained on unlabeled data without any proper guidance. It automatically infers patterns and relationships in the data by creating clusters. The model learns through observations and deduced structures in the data.
Principal component Analysis, Factor analysis, Singular Value Decomposition, etc.
C. Reinforcement Learning:
The model learns through a trial and error method. This kind of learning involves an agent that will interact with the environment to create actions and then discover errors or rewards of that action.
3. What is the difference between deep learning and machine learning?
Machine Learning:
- Machine learning refers to algorithms that learn patterns from data without human programming. It uses a variety of models like decision trees, support vector machines, and linear regression to make predictions. ML typically works with structured data and requires feature engineering, where a human expert selects the features that are important for training the model.
Deep Learning:
- Deep learning is a specialized subset of machine learning that uses artificial neural networks with many layers (hence “deep”). It can automatically learn features from raw data (e.g., images or text) without the need for manual feature extraction. Deep learning models are more computationally intensive and require larger datasets but are capable of achieving remarkable performance in tasks like image recognition, speech-to-text, and natural language processing.
Key Difference:
- Deep learning models often outperform traditional machine learning models for tasks involving unstructured data (like images, video, and audio) because they can automatically learn hierarchical features from the data. However, deep learning requires more data and computational resources.
4. What is the main key difference between supervised and unsupervised machine learning?
Supervised Learning:
- In supervised learning, the model is trained on labelled data, meaning the input data is paired with the correct output (target). The goal is for the model to learn the relationship between inputs and outputs so it can predict the output for unseen data.
- Example: Predicting house prices based on features like size, location, and number of rooms.
Unsupervised Learning:
- In unsupervised learning, the model is trained on data that does not have labeled outputs. The goal is to find hidden patterns, structures, or relationships in the data. Common tasks include clustering and dimensionality reduction.
- Example: Grouping customers based on purchasing behaviour without knowing the specific categories beforehand.
Key Difference:
- Supervised learning has labeled data and learns a specific mapping between input and output, whereas unsupervised learning works with unlabeled data and tries to uncover hidden structures or groupings.
5. How are covariance and correlation different from one another?
Covariance:
- Covariance measures the degree to which two variables change together. If both variables increase together, the covariance is positive; if one increases while the other decreases, the covariance is negative. However, covariance does not have a normalized scale, so its value can be hard to interpret.
Correlation:
- Correlation is a normalized version of covariance, which measures the strength and direction of the relationship between two variables. It ranges from -1 to 1. A correlation of 1 means a perfect positive relationship, -1 means a perfect negative relationship, and 0 means no linear relationship. Correlation standardizes the covariance to make the relationship easier to interpret.
To dive deeper into the differences between covariance and correlation, check out our detailed guide on Covariance vs Correlation.
6. State the differences between causality and correlation.
Causality:
- Causality refers to a cause-and-effect relationship between two variables. If variable
A causes variable B, then changes in A directly lead to changes in B. Establishing causality often requires controlled experiments or deep domain knowledge and is more complex to prove.
Correlation:
- Correlation refers to the statistical relationship between two variables, meaning they tend to vary together, but it does not imply one causes the other. For example, there might be a correlation between ice cream sales and drowning incidents, but it does not mean that ice cream consumption causes drownings. It could be due to a third factor, such as hot weather.
Key Difference:
- Causality establishes a direct cause-and-effect relationship, while correlation only suggests that two variables move together without implying causality.
7. What is Bias, Variance, and what do you mean by Bias-Variance Tradeoff?
They are both Errors in the Machine Learning Algorithms. This was just to say that when the algorithm can’t really afford to generalize the right observation from the data, bias occurs. Now variance happens when the model overfits to small changes.
When building a model, if one starts adding more features, it will increase the complexity and we will lose on the bias but we gain some variance. This is a trade-off between bias and variance, in order to find the “perfect amount of error”.
Bias:
- Approximating real world problem with a simple model induces error which we call the bias. A high bias model relies heavily on the assumptions about the data, thus underfiting the data.
Variance:
- Variance refers to the model’s sensitivity to small fluctuations in the training data. A high-variance model may overfit the data, capturing noise or outliers instead of general patterns, leading to poor performance on unseen data.
Bias-Variance Tradeoff:
- The bias-variance tradeoff is the balance between bias and variance. A model with high bias tends to underfit, while a model with high variance tends to overfit. The goal is to find a model that minimizes both bias and variance, resulting in the best generalization to unseen data.
8. What is Time Series?
A Time Series is a sequence of data points indexed or ordered by time. Time series data is typically collected at consistent intervals (e.g., hourly, daily, monthly) and is used for forecasting or identifying patterns over time. Time series analysis involves understanding trends, seasonality, and cyclical behavior to predict future values.
- Example: Stock market prices, weather forecasting, and website traffic.
9. What is a Box-Cox transformation?
Box-Cox transformation is a power transformation of non normal dependent variable to normal variable because normality is the most common assumption made when we use many statistical techniques. It has a lambda parameter which, when set to 0, means we are equating this transform to log transform. That is used as variance stabilization and to normalize the distribution.
10. Explain the differences between Random Forest and Gradient Boosting machines.
Random Forest:
- Random forest is considered an ensemble learning method that utilizes multiple decision trees trained on random subsets of the data. It uses bagging (Bootstrap Aggregating) to reduce variance by averaging the predictions of many trees. It works well for both classification and regression tasks and is robust against overfitting due to its random sampling.
Gradient Boosting Machines (GBM):
- An ensemble method along the lines of Gradient Boosting is one that takes weak learners (usually decision trees) and improves their performance iteratively by building them sequentially. The loss function is minimized for each new tree, with errors from the previous ones. It sees more prone overfitting, but can also achieve better accuracy when tuned optimally.
Key Differences:
- Training Method: Random Forest builds trees independently, while Gradient Boosting builds trees sequentially.
- Overfitting: Gebesttingen is more prone to overfitting, but Random Forest is less so.
- Performance: GBM typically provides better accuracy, but Random Forest is faster to train and easier to tune.
Conclusion
In order to prepare for Machine Learning interviews one needs to have some theoretical understanding and also apply what you have learnt through practical examples. With thorough revision of questions and answers for basic, intermediate and advanced levels, you can comfortably show your ML fundamentals, algorithms, and latest techniques.To further enhance your preparation:
- Practice Coding: Implement algorithms and build projects to strengthen your practical understanding.
- Understand Applications: Learn how ML applies to industries like healthcare, finance, and e-commerce.
- Stay Updated: Follow the latest research and developments in AI and ML.
Finally, remember that ML interviews often test problem-solving skills in addition to theoretical knowledge. Stay calm, think critically, and communicate your thought process clearly. With thorough preparation and practice, you’ll be ready to excel in any ML interview.
Good luck!
Machine Learning Interview Questions FAQ’s
Most hiring companies will look for a master’s or doctoral degree in the relevant domain. The field of study includes computer science or mathematics. But having the necessary skills even without the degree can help you land a ML job too.
Machine Learning is a vast concept that contains a lot different aspects. With the right guidance and with consistent hard-work, it may not be very difficult to learn. It definitely requires a lot of time and effort, but if you’re interested in the subject and are willing to learn, it won’t be too difficult.
You will need to know statistical concepts, linear algebra, probability, Multivariate Calculus, Optimization. As you go into the more in-depth concepts of ML, you will need more knowledge regarding these topics.
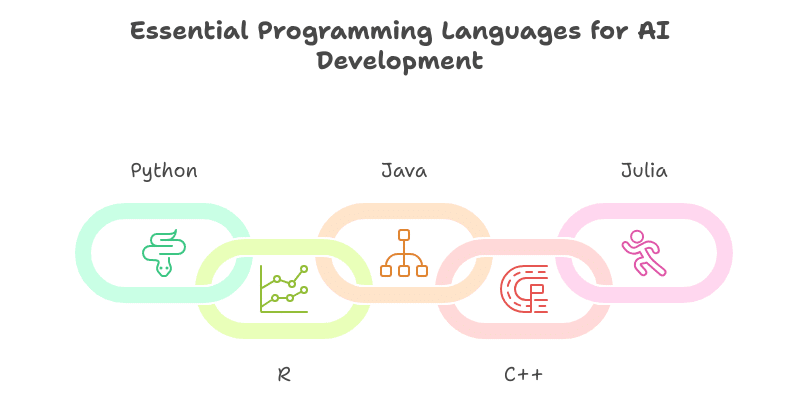
Programming is a part of Machine Learning. It is important to know programming languages such as Python.
Stay tuned to this page for more information on interview questions and career assistance. You can check our other blogs about Machine Learning for more information.
You can also take up the PGP Artificial Intelligence and Machine Learning Course offered by Great Learning in collaboration with UT Austin. The course offers online learning with mentorship and provides career assistance as well. The curriculum has been designed by faculty from Great Lakes and The University of Texas at Austin-McCombs and helps you power ahead your career.
Our Machine Learning Courses
Explore our Machine Learning and AI courses, designed for comprehensive learning and skill development.
| Program Name | Duration |
|---|---|
| MIT No code AI and Machine Learning Course | 12 Weeks |
| MIT Data Science and Machine Learning Course | 12 Weeks |
| Data Science and Machine Learning Course | 12 Weeks |