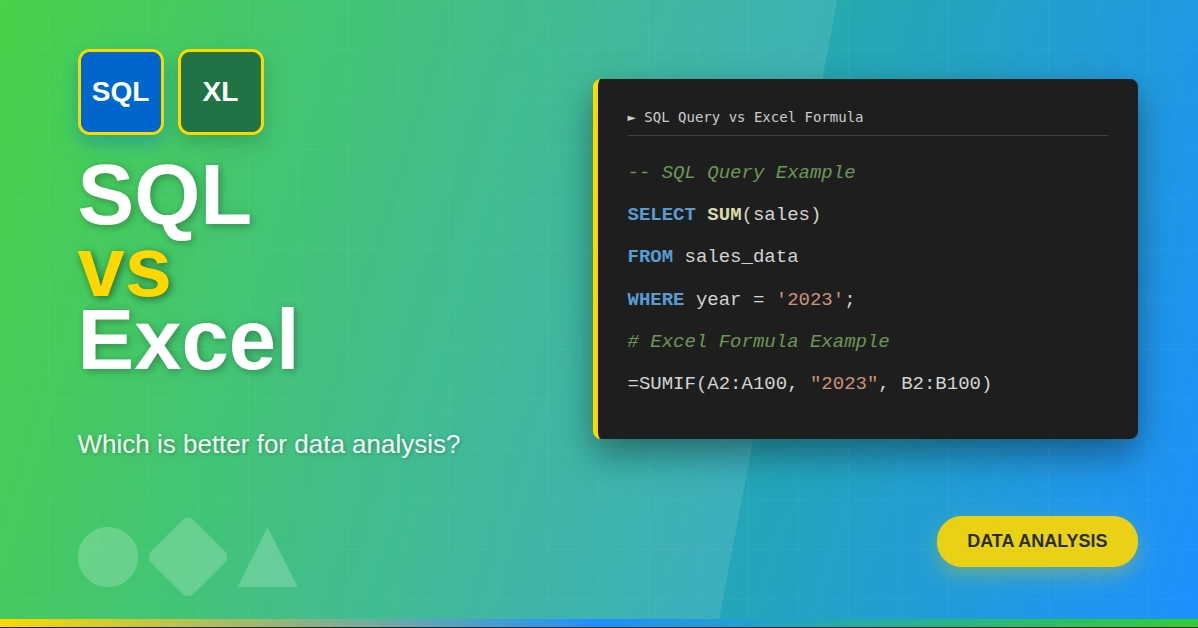
Imagine a large heap of information, including sales figures, client records, marketing facts, and more. You want to convert that pile to intelligible ideas. What is the first tool you pick? SQL or Excel? They are both essential components of the data world, and being familiar with their usage is a powerful ability. In the Data Analytics in SQL & Excel Course, individuals learn how these tools complement each other and why they do not need to choose a single one. They are being taught how to use them effectively.
This article discusses the purpose of using SQL and when to use Excel. It also demonstrates practical use cases, the most current usage rates, and the place of both tools in the contemporary data work processes.
A Quick Overview: Excel and SQL in Today’s Data World
Excel: The Swiss Army Knife of Quick Analysis
Microsoft Excel has been the go‑to tool for analysts since its debut in 1985. Its ease of use, intuitive interface, and powerful built-in functions remain unmatched for fast, exploratory tasks:
- Pivot Tables for aggregating and summarizing data with a drag-and-drop interface
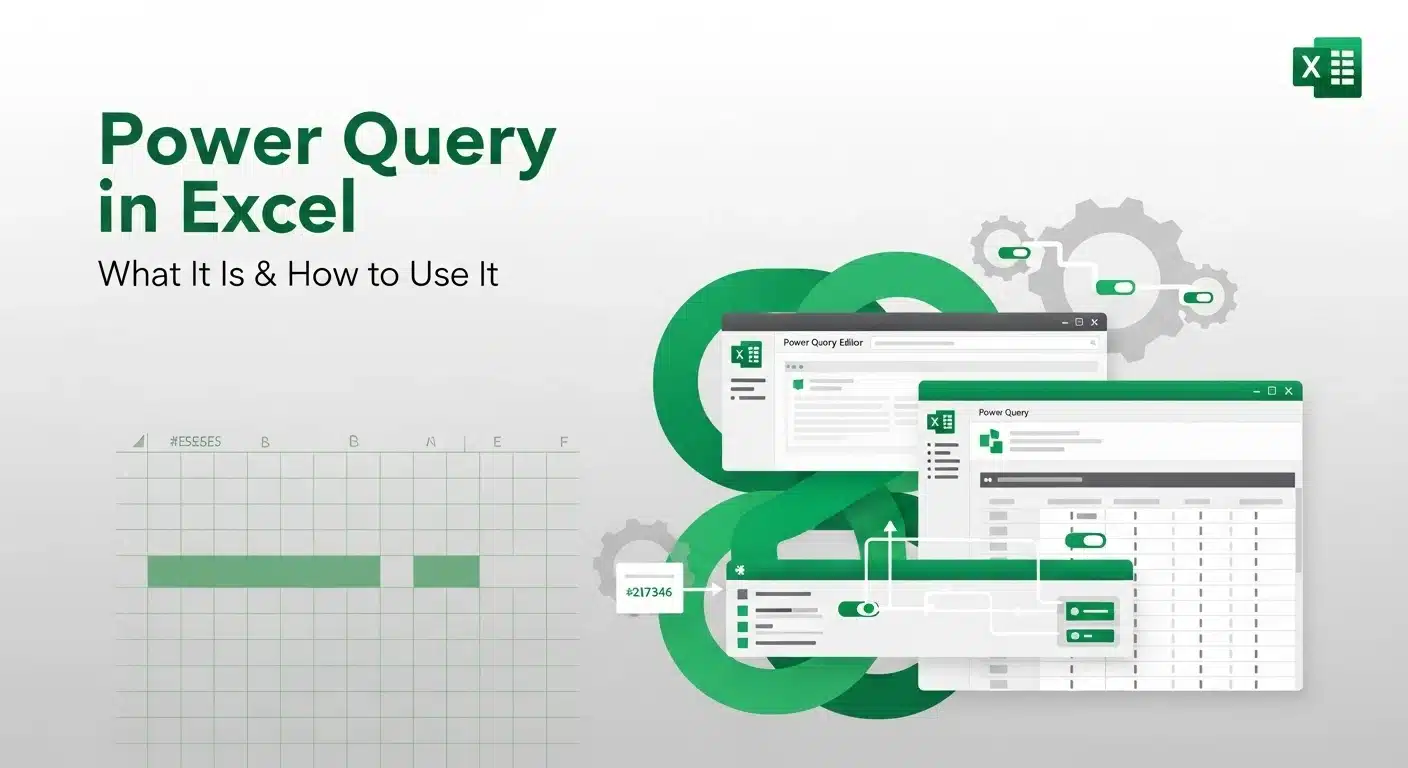
- Power Query & Power Pivot for onboarding and analyzing larger datasets within Excel
- Instant Visuals, charts, and conditional formatting to highlight key trends.
Despite the emergence of specialized analytics tools, Excel remains a cornerstone in data analysis due to its ubiquity and speed of use.
Learn Excel for powerful data analysis and enhance your skills for better decision-making.
SQL: The Backbone of Large-Scale Data Handling
Structured Query Language (SQL), standardized in the mid-1980s, has evolved over the years to become the cornerstone of modern data management. The latest iteration, SQL Server, brings even more power to the table, enhancing its ability to handle vast datasets with advanced features.
SQL excels in:
- Querying and transforming massive datasets stored in relational databases with efficiency and speed, now further optimized with enhancements like vector search and AI integration in SQL Server.
- Enforcing data integrity through ACID properties (Atomicity, Consistency, Isolation, Durability), ensuring reliable, consistent, and durable transactions, even with complex, large-scale operations.
- Joining multiple tables, filtering, aggregating, and executing advanced queries efficiently, enhanced by features like Property Graph Queries (PGQ), which allow users to model and analyze intricate relationships in data.
SQL continues to power everything from backend data infrastructure to analytics pipelines and business intelligence (BI) systems across various industries, including finance, e-commerce, healthcare, and more. With SQL Server 2025, SQL remains a vital tool for managing, securing, and analyzing data, driving innovation in both traditional and AI-driven applications.
Master SQL and Database management with this SQL course: Practical training with guided projects, AI support, and expert instructors.
Learn SQL for data analytics in this course designed to help you turn raw data into clear insights. Master essential tools and techniques to make smarter, data-driven business choices.
When to Choose Excel
Speed and Simplicity
Excel shines when you need quick answers with minimal setup. You can:
- Import a CSV or copy-paste data in seconds.
- Create pivot tables and charts immediately.
- Use filters and formulas like VLOOKUP, INDEX-MATCH, and built-in statistics..
Low Barrier to Entry
Excel requires little to no coding knowledge. Professionals can start using it effectively almost immediately:
- Familiar UI even for non-technical users.
- Shared spreadsheets enhance collaboration across teams.
- It’s a perfect gateway to more advanced analytics workflows.
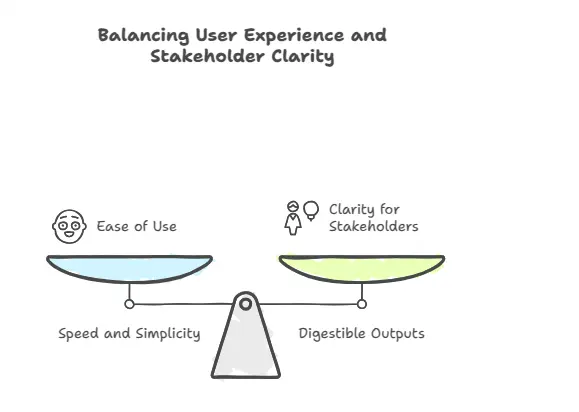
Digestible Outputs for Non-Technical Stakeholders
Visualizations in Excel are easily understandable and printable. Executives and managers often feel most comfortable reviewing spreadsheets.
Excel for Beginners Free Course
Learn essential Excel skills for data analysis, including functions, formulas, and data visualization techniques. Master cell referencing, sorting, and creating charts and presentations.
When to Rely on SQL
Scalability and Performance
Excel’s row limit (~1 million rows per sheet) is restrictive. SQL databases, however, can easily handle hundreds of millions of records with efficient indexing and querying
Data Integrity and Relationships
SQL enforces referential integrity (e.g., foreign keys), preventing inconsistent or orphaned records. Studies highlight the importance of this when managing complex models, such as invoices linked to customers.
Automation and Repeatability
- Schedule SQL scripts to run nightly, feeding BI tools like Power BI or Tableau.
- Templates and stored procedures ensure consistent, repeatable results without human intervention.
Data Visualization using Tableau
Learn how to use Tableau for data visualization and transform raw data into meaningful insights. With interactive charts and dashboards, you can easily explore trends and make informed decisions.
Complex Queries Across Tables
SQL excels at join operations, window functions, aggregations, and more. Think of scenarios like:
- Combining customer transactions, website activity, and customer profiles in one query.
- Rolling month-over-month comparisons, cohort analysis, or time-based aggregations.
Side-by-Side Comparison
| Feature | Excel | SQL |
| Ease of use | Very easy; GUI-driven | Moderate; requires coding |
| Scalability | Up to ~1 million rows | Handles millions+ |
| Data integrity | Limited constraints, manual handling | ACID-compliant, strong relationships |
| Automation | Manual/limited via VBA | Strong via scripts/procedures |
| Sharing & collaboration | Shared files, cloud sheets | Shared via DB server access |
| Data modeling | Flat tables, Power Query, Power Pivot | Full relational schemas |
| Analysis complexity | Simple-to-medium tasks | Complex, multi-layer models |
| Reporting & visuals | Pivot charts, dashboards | Used mainly by BI tools |
Real-World Scenarios
Marketing Team: Excel for Campaign Analysis
A marketing team downloads weekly campaign performance data, including clicks, spend, and conversions. In Excel, they:
- Merge data using Power Query.
- Build pivot tables to compare channels.
- Add charts and slicers for interactive views.
Result: A polished report they can share and present in under an hour—no technical backlog required.
E-Commerce Analyst: SQL for Customer Behavior
An e-commerce analyst queries a relational database:
- Selects orders and the customer table.
- Joins with web session logs.
- Filters for orders in the past year.
- Groups by product categories.
SQL generates insights from millions of rows, and results are imported into Excel for dashboard creation using Power Pivot.
Finance Team: Hybrid Workflow
Finance analysts use SQL to pull daily transactions and ledger data. They store aggregated tables (sales by product, by month) and then use Excel to:
- Load summary tables via Power Query.
- Refine with macros or modeling tools.
- Generate reports shared with executives.
This blend ensures scale, accuracy, and visual polish.
Latest Stats: Why Both Are Still Critical
Excel's Endurance
- SheetFlash (2025): Excel remains central for data scientists around the globe, favored for its familiarity and ease in quick validations
- Splunk (2025): Confirms Excel is still a top tool for cleaning, manipulating, and visualizing data
- ProCogia (May 2025): Excel retains its place thanks to AI features like Copilot, Power Query, and embedded Python support
Combined Workflows on the Rise
- Over 50% of data professionals regularly use both SQL and Excel in their workflows
What’s Next in the Data Landscape
AI and Automation
- Excel now integrates AI tools like Copilot, and supports Python, bridging the gap between spreadsheet convenience and programming power.
- SQL platforms increasingly embed ML capabilities (e.g., SQL Server Analysis Services with neural nets, clustering, regression) for in-database analytics
Hybrid Skill Demand
Modern data roles expect familiarity with both:
- SQL for querying and handling backend datasets.
- Excel for dashboards, quick checks, and communicating insights.
Platforms like Power BI and Looker rely on SQL for data models and Excel for fine-tuning when BI needs adjustments.
Platforms like Power BI and Looker rely on SQL for data models and Excel for fine-tuning datasets before visualization. If you want to understand how these tools connect, a Free Power BI course is a great starting point to learn dashboard creation and data visualization techniques.
Free Data Visualization Power BI Course
Learn how to create interactive visualizations, understand their role in decision-making, and master Power BI’s core features in this course.
Summary: What Tool Fits Which Task?
Use Excel when:
- You need fast, ad-hoc analysis with visuals.
- Your dataset is “small-to-medium” (under ~1 million rows).
- You’re collaborating with non-technical stakeholders.
- You need simple reporting without needing to learn to code.
Use SQL when:
- Processing or querying large datasets.
- You need to enforce data integrity and relationships.
- Automating repeatable data tasks is critical.
- Handling complex queries across multiple tables.
The Smart Approach: Use Both
- Extract and prepare data with SQL.
- Import and visualize through Excel (via Power Query or direct connection).
- Automate SQL extracts and refresh Excel-based dashboards for a streamlined workflow.
Getting Started: Build Your Skills
If you're serious about mastering data analysis, combining both tools is essential. Learning paths, such as Data Analytics SQL courses, offer a balanced and practical introduction.
- Core SQL querying (SELECT, JOIN, GROUP BY, window functions).
- Excel essentials (pivot tables, Power Query, Power Pivot, macros).
- Integration workflows (connecting Excel to databases, fresh data pipelines).
- Real-world projects and hands-on labs tailored for career applications.
And, Get practical on your skills at SQL Editor Tool.
Final Thoughts
There’s no “one-size-fits-all” answer to SQL vs. Excel; both tools serve unique purposes and, when used together, unlock powerful capabilities.
- Excel gives you speed, agility, and immediate insights.
- SQL handles scale, structure, and robust data processing.
By learning SQL for data analysis and pairing it with Excel, you develop a well-rounded toolkit that’s highly valued across industries. As data volumes grow and automation becomes the norm, this combination will continue to shape the future of analytics.
To check learning better, take Data Analysis Quiz.
Frequently Asked Questions(FAQ’s)
1. When should I choose Excel for data analysis?
Excel is useful when you have a small to medium dataset (which fits within one sheet, up to about 1 million rows) and you are doing a no-preparation analysis. It is ideal when creating pivot tables, creating charts, and displaying data without coding. Another reason why Excel is good is when you have to work with non-technical stakeholders who require simple, understandable reports.
2. When should I choose SQL for data analysis?
SQL performs well when dealing with large datasets- thousands or millions of rows. It is also excellent when you want to search over a large number of records, maintain data precision, configure routine jobs, and process difficult questions, which join multiple tables. You should use SQL only in case you have to handle massive data or ensure related items fit.
3. Can I use SQL and Excel together for data analysis?
Yes, it is smart to combine SQL and Excel. SQL makes it possible to pull and clean large data sets and view and refine them with the use of Power Query, Power Pivot, and pivot tables of Excel. Most data analysts use the combination of these programs since SQL works great on large amounts of data, and Excel provides convenience and flexibility.
4. How do Excel and SQL compare in terms of scalability?
Excel supports approximately 1 million rows on a sheet which is not sufficient with very large data sets. SQL, however, is designed in such a way that it can process millions or even billions of rows without difficulties and thus it should be used with data requiring large-scale operations and with complex queries that cannot be easily performed using Excel.
5. Is it necessary to learn both SQL and Excel for data analysis?
Being familiar with SQL and Excel can be quite useful to a data analyst. Excel is good when you need to make fast charts, reports, and work with small datasets; SQL can be used to query and process large sets of data, automate anything, and maintain the accuracy of data. Possessing the knowledge of both tools will provide you with a solid, well-rounded skill set that can be recruited in the industry.
6. What are some real-world examples of using SQL and Excel together?
SQL is capable of extracting daily transactions and combining the data for a finance team. Excel can be used to refine the final data using Power Query and PivotTables. A marketing team would also use pivot tables in Excel and charts to analyze the performance data of a campaign, and SQL would extract and aggregate the data out of a database.
7. What are the latest trends in SQL and Excel for data analysis?
Excel continues to expand. It has the new AI-assisted (Copilot), embedded Python code, and more powerful Power Query features. Meanwhile, SQL platforms are gaining the ability to do machine learning so analytics can occur within the database. Individuals usually integrate these tools in hybrid workflows, where they use BI software like Power BI and Tableau to provide them an entire view of their data.