
Introduction
We did this case study as a part of our capstone project at Great Lakes Institute of Management, Chennai. After we presented this study, we got an overwhelming response from our professors & mentors. Later, they encouraged us to share our work to help others learn something new.
So, using this case study we’ve analyzed the crisis communication on Twitter happened during Chennai Floods. Also, we’ve discovered patterns & themes of communication, the way in which the platform was used to share information and how it shaped response to the crisis. After successfully finishing our study, the following objectives were achieved:
Topic analysis of social media interactions to understand the different subjects of interactions, information sharing and grouping geographies into riskGrouping similar messages together with emphasis on predominant themes (rescue, food, supplies, ambulance calls)
This study is done on a set of social interactions limited to the first two days of December 2015, as these were the worst days of the crisis. The analysis was restricted to a set of 6000 tweets, for want of computing power. The tweets were extracted by looking for the hashtag #ChennaiFloods.
Among analytical approach & tools used, Topic Analysis of tweets is done using Latent Dirichlet Allocation. K-Means & Hierarchical Clustering is employed on the themes of tweets. Tableau is used to create word clouds. Microsoft Excel and Word is used to perform spellchecks on extracted words.
The findings of this study explores the viability of analyzing Twitter communication real-time with an aim of providing timely assistance to the affected areas.
Table of Contents
Chennai Floods – Quick Story
Exploratory Data Analysis
2.1 – The Typical Tweet
2.2 – Data Extraction
2.3 – Data Preparation & Exploration
2.4 – Text Preparation
2.5 – Word Frequencies and Associations
Clustering and Topic Modeling
3.1 – Hierarchical Clustering
3.1.1 – Interpretation
3.2 – k-Means Clustering
3.2.1 – Choosing k
3.3 – Topic Modeling
3.3.1 – Latent Dirichlet Association
Conclusion
4.1 – Limitations of this study
4.2 – Challenges in Real Time Analysis of Tweets
4.3 – Applications and Scope of Further Work
Our learning & Journey
1. Chennai Floods – Quick Story
In November–December 2015, the annual northeast monsoon generated heavy rainfall in theCoromandel Coast region of the South Indian States of Tamil Nadu and Andhra Pradesh, the union territory of Pondicherry with the city of Chennai particularly hard-hit.
Termed 2015 South Indian floods as the ‘black swan’ caused an enormous destruction. It is estimated that around 500 people lost their lives and over 18 lakh (1.8 million) people were displaced.
With approximations of damages and losses ranging from ₹50000 crore (US$7 billion) to ₹100000 crore (US$15 billion), the floods were the costliest to have occurred in 2015, and were among the costliest natural disasters of the year. The flooding has been attributed to the El Niño phenomenon.
In the city of Chennai, the impact of the heavy rainfall was compounded by the overfull water reservoirs, which soon started to spill over into the city. Whole neighborhoods were inundated, with loss of power, communication and access to essentials.
The National Disaster Response Force (NDRF), the Indian Army and disaster management units were pressed into service. Rescue and rehabilitation efforts spanned well over 2 weeks.
What emerged conspicuously during this unprecedented crisis was the coordination of relief efforts over social media platforms such as Twitter, Facebook and WhatsApp. Volunteers, NGOs and other rescue parties were observed to be sending out alerts, requests and sharing useful information related to the flooding on social media. Others used social media to check up on their loved ones, share information, express opinions and sending out requests for help.
2. Exploratory Data Analysis
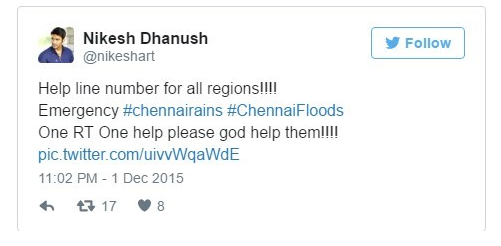
2.1 The typical tweet
A tweet is a social media message posted on Twitter.com. It is restricted to 140 characters. Though most tweets contain mostly text, it is possible to embed URLs, pictures, videos, vines and GIFs.
Tweets contain components called hashtags, which are words that capture the subject of the tweet. They are prefixed by the ‘#’ character. They can also convey emotion (#sarcasm) or an event (#IndiaVsPakistan), or popular catchphrases in pop culture (#ICantBreathe).
The usernames or handles of those who post are recognized by the ‘@’ symbol. A user can direct a message to another user by adding the handle with the ‘@’ symbol.
A retweet (‘rt’ for short) is a tweet by a user X that has been shared by user Y to all of Y’s followers. Thus, retweets are a way of measuring how popular the tweet is.
A user can ‘favorite’ a tweet; this is analogous to a ‘Like’ on Facebook.
Also, uncover how Excel Data Analytics can help solve the Transportation Problem
2.2 Data Extraction
Twitter has an official API called OAuth, a token-based authentication system that indexes tweets that match a given search string and writes the output to a file. While this service is free and convenient to perform a quick and efficient extraction of tweets, it has a crucial limitation: it can retrieve tweets only from the previous week.
Hence, a GitHub repository on the code-sharing portal was utilized to search for and extract tweets. The search term was the hashtag #ChennaiFloods. The python language was used (in an Ubuntu Linux environment) to perform the extraction; the extracted tweets were written to a comma-separated value file.
Check out the Sentiment analysis using python course to enhance your knowledge.
2.3 Data Preparation & Exploration
The information gathered contained hashtags and mentions of the users who tweeted about this event. These were separated in R using regular expressions.
The following wordcloud shows the hashtags used in the tweets.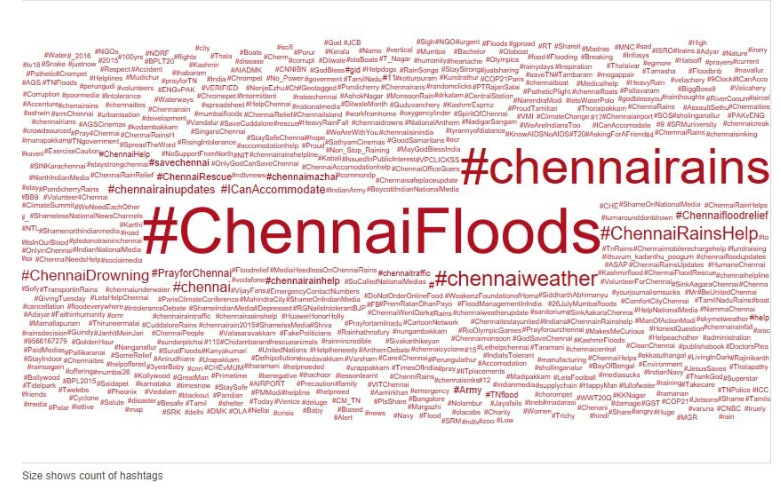
From the hashtags used, the following themes are evident, other than the disaster itself:
Sympathy (#PrayForChennai)
Requests for help (#savechennai, #ChennaiRainsHelp)
Information on further weather forecasts (#chennaiweather)
Information on specific areas in Chennai (#airport, #Chromepet)
Cautionary messages (#ExerciseCaution)
Various hashtags for the same topic are observable. This would make it challenging to separate all tweets on the subject.
The below chart shows the top 10 active Twitter users that participated in relief efforts. Some handles belong to prominent celebrities.
(It must be noted that these facts are true only with respect to the tweets collected; in reality, if all the tweets on the subject were analyzed, it is likely the no. of retweets, tweets & favorites per user may change.)
Retweets are also likely to be heavily favorited.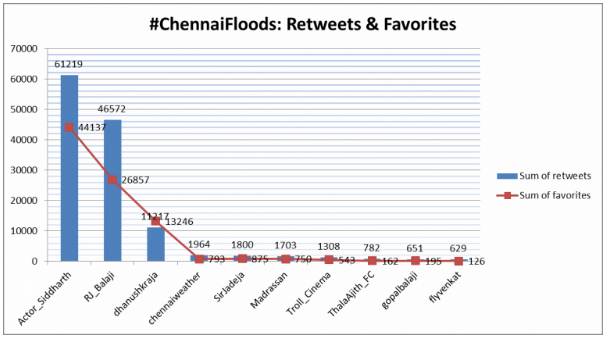
2.4 Text Preparation
The tweets were parsed into a corpus for text analysis. The following steps were executed to clean the corpus and prepare it for further analysis. Only the text portion of the tweet (the actual message) was considered.
Removing numbers: TweetIDs are number generated by Twitter to identify each tweet. Numbers as such don’t serve any purpose for text analysis and hence they are discarded.
Removing URLs & links: Many tweets contained links to webpages and videos elsewhere on the Internet. These were removed with regular expressions.
Removing stopwords: Stopwords are words in English that are commonly used in every sentence, but have no analytical significance. Examples are ‘is’, ‘but’, ‘shall’, ‘by’ etc. These words were removed by matching the corpus with the stopwords list in the tm package of R. Expletives were also removed.
Removing non-English words: The corpus generated after performing the last 3 steps were broken into their constituent words and all English words and words less than 4 characters long were removed. What remained was the list of non-English words, words that mentioned areas in Chennai, words that are actually Tamil words written in English and misspellings of normal English words.
The non-English words that denoted the names of localities were used to form a wordcloud.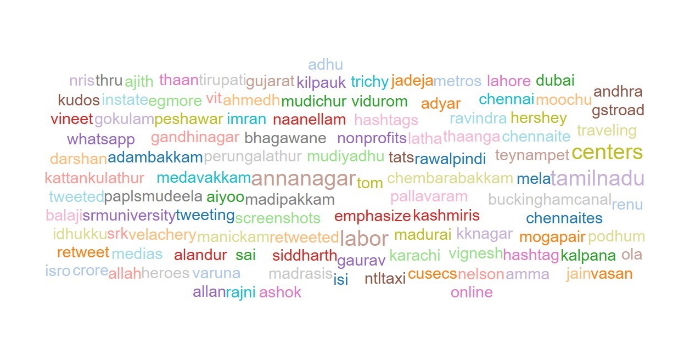
Stemming words: In text analysis, stemming is ‘the process of reducing inflected (or sometimes derived) words to their word stem, base or root form—generally a written word form’. Stemming is done to reduce inflectional forms and sometimes derivationally related-forms of a word to a common base form. Many methods exist to stem words in a corpus.
Suffix-dropping algorithms: The last parts of all the words get truncated. For example, words like ‘programming’, ‘programmer’, ’programmed’, ‘programmable’ can all be stemmed to the root ‘program’. On the other hand, ‘rescuing’, ‘rescue’, ‘rescued’ are stemmed to form ‘rescu’, which is not a word or a root. This method was chosen for this study for simplicity.
Lemmatisation algorithms: Each word is the determination of the lemma for a word in the corpus. This is done with the understanding of the context, part of speech and the lexicon for the language. For example, ‘better’ is related to ‘good’, ‘running’ is related to ‘walk’ and so on.
n-gram analysis: Each word is broken into a part of its whole by ‘n’ characters, and the one that makes most sense is retained. For example, for n=1 (unigram), the letters ‘f’, ’l’, ’o’, ’o’, ’d’ are individually parsed from ‘flood’. For a higher n (say n=5), ‘flood’ is retained from ‘flooding’, although at n=4, ‘ding’ can also be construed as a word.
Removing punctuation: Punctuation marks make no impact to the analysis of text and are hence removed.
Stripping whitespace: Words that have extra whitespaces at the beginning, middle or end are subjected to a regular expression that removes the whitespace and retains only the words themselves.
Checking for impure characters: A check on the corpus after the modifications made thus far revealed that some URLs were left behind, due to the removal of whitespaces, numbers and punctuations. Regular expressions were used to remove them.
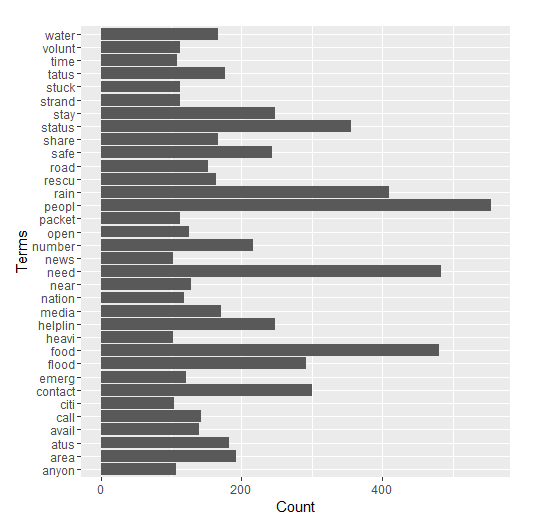
2.5 Word Frequencies and Associations
After the necessary cleaning, another wordcloud was plotted to understand the most frequently used terms. The following observations are made:
A few simple words repeat more often than others: ‘people’, ‘stay’, ’safe’, ‘food’ etc. These are immediate reactions and responses to the crisis.
Some infrequent terms are ‘street’, ‘nagar’, ‘mudichur’, ‘road’ etc. that give information about the situation in a few areas.
Words like ‘pray’, ‘hope’ and ‘proud’ are also used, in messages that mostly convey sympathy or hope.
There were tweets about news reports covering the crisis, with words like ‘channel’, ‘media’ etc.
Words like ‘help’, ‘please’, ‘food’ etc. were used in tweets that requested for volunteers to participate in rescue and rehabilitation efforts.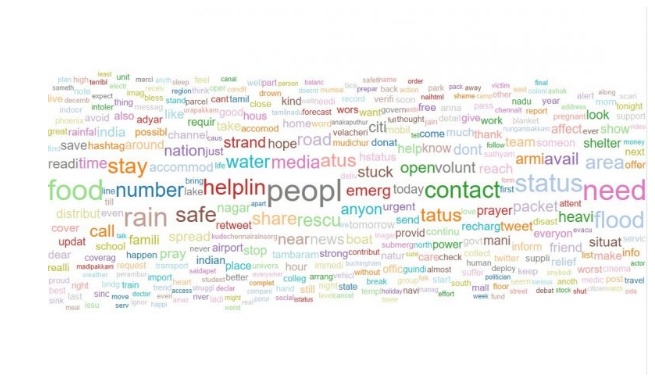
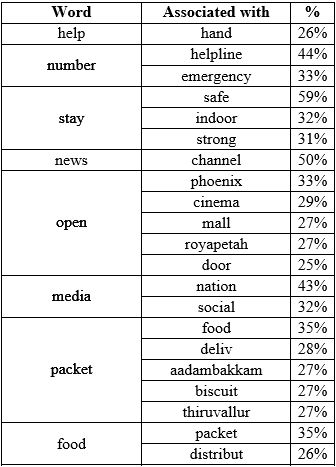
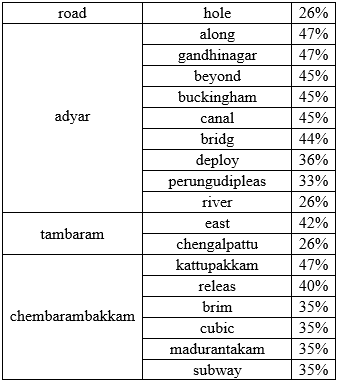
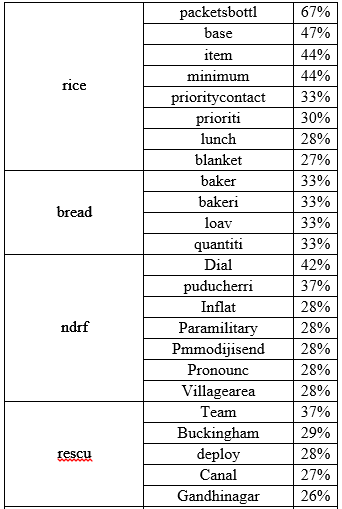
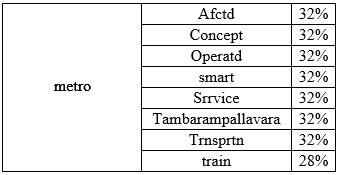
A few words are associated strongly with the most frequent words than others. The below table describes the most common word associations.
It was observed that the names of many localities feature in the associations list. These localities were mentioned with a lot less frequency than those in Figure 4. Considering these associations are from a list of 6303 tweets, more associations and localities are likely to emerge if the entire set of tweets on the crisis is considered.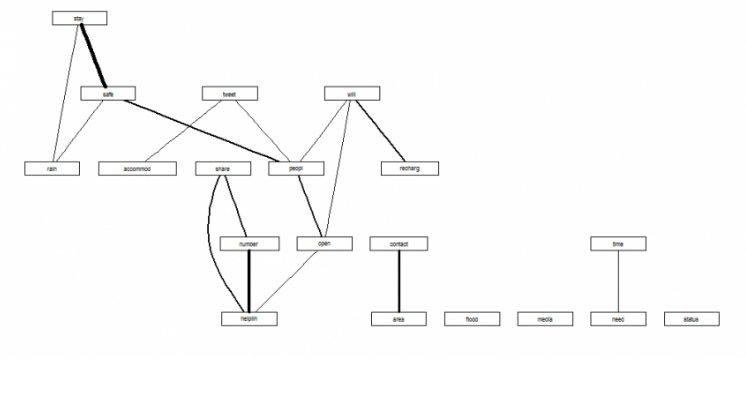
3. Clustering and Topic Modeling
When a crisis like the Chennai floods strikes, a large number of similar tweets get generated that it becomes challenging to make meaningful interpretations from the huge volumes of data that need to be processed.
One solution is to cluster similar tweets together after performing the necessary EDA operations that it becomes easier to manage the flow of information.
Check out our blog on Introduction to Spectral Clustering to learn more about this advanced clustering technique.
3.1 Hierarchical Clustering
Hierarchical clustering attempts to build different levels of clusters. Strategies for hierarchical clustering fall into two types (Wikipedia, n.d.):
Agglomerative: where we start out with each document in its own cluster. The algorithm iteratively merges documents or clusters that are closest to each other until the entire corpus forms a single cluster. Each merge happens at a different (increasing) distance.
Divisive: where we start out with the entire set of documents in a single cluster. At each step the algorithm splits the cluster recursively until each document is in its own cluster. This is basically the inverse of an agglomerative strategy.
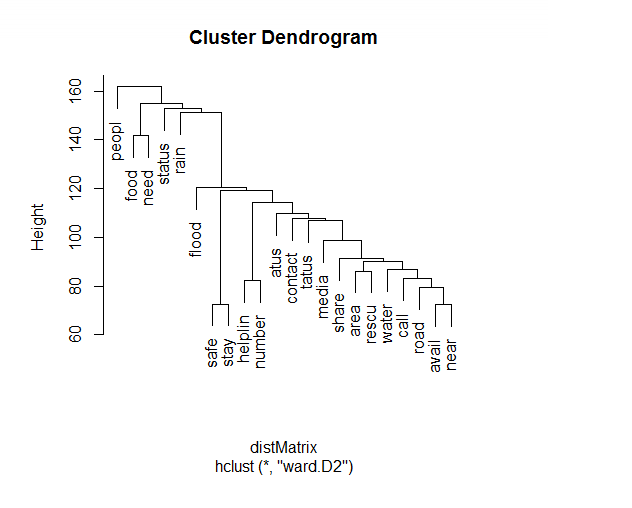
The results of hierarchical clustering are usually presented in a dendrogram.
The R function, hclust() was used to perform hierarchical clustering. It uses the agglomerative method. The following steps explain hierarchical clustering in simple terms:
Assign each document to its own (single member) cluster
Find the pair of clusters that are closest to each other and merge them, leaving us with one less cluster
Compute distances between the new cluster and each of the old clusters
Repeat steps 2 and 3 until you have a single cluster containing all documents
To perform this operation, the corpus was converted into a matrix with each tweet (or ‘document’) given an ID. Extremely sparse rows, i.e. rows with elements that are part of less than 2% of the entire corpus were removed. Ward’s method for hierarchical clustering was used.
The dendrogram output is to be interpreted as follows:
Farther the nodes, greater is the dissimilarity and more robust is that
The closer the node, the weaker is the
The height of each node in the plot is proportional to the value of the intergroup dissimilarity between its two
Also don’t miss out on valuable resources!
Learn where to find Free Data Sets for Analytics/Data Science Project in latest blog post
3.1.1 Interpretation
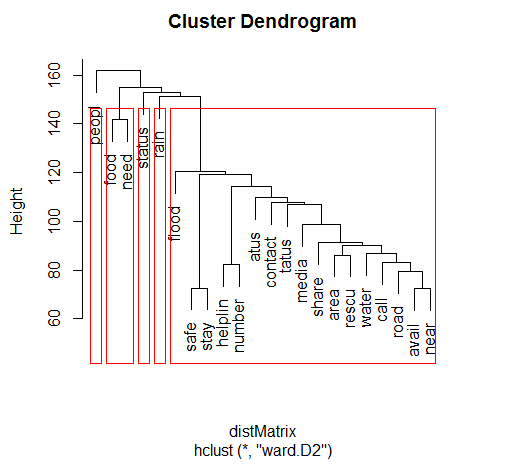
The following distinct clusters of tweets are observable from the dendrogram:
Tweets that talk about general information about affected individuals, areas and news about the crisis.
Tweets that talk about food, supplies and rescue efforts.
Tweets that describe the weather, forecasts of rain and further developments.
Tweets that caution people on risky areas and share information on relief efforts.
It is also seen that there is a significant similarity between clusters of tweets; this is expected as the terms used across tweets are more or less similar.
No locality or specific names are mentioned as the clustering was performed on a matrix that did not contain such rarely-occurring terms.
3.2 K-Means Clustering
As opposed hierarchical clustering, where one does not arrive at the number of clusters until after the dendrogram, in K-means, the number of clusters is decided beforehand. The algorithm then generates k document clusters in a way that ensures the within-cluster distances from each cluster member to the centroid (or geometric mean) of the cluster is minimized.
A simplified description of the algorithm is as follows:
Assign the documents randomly to k bins
Compute the location of the centroid of each
Compute the distance between each document and each centroid
Assign each document to the bin corresponding to the centroid closest to
Stop if no document is moved to a new bin, else go to step
3.2.1 Choosing k
The most significant factor of employing k-means clustering is choosing the no. of clusters, ‘k’. The ‘elbow method’, wherein the SUM of Squared Error (SSE, the sum of the squared distance between each member of the cluster and its centroid) decreases abruptly at that value that is theoretically the optimal value of k, is widely applied to arrive at k.
When k is plotted against the SSE, it will be seen that the error decreases as k gets larger; this is because when the number of clusters increases, they become smaller, and hence the distortion is also smaller.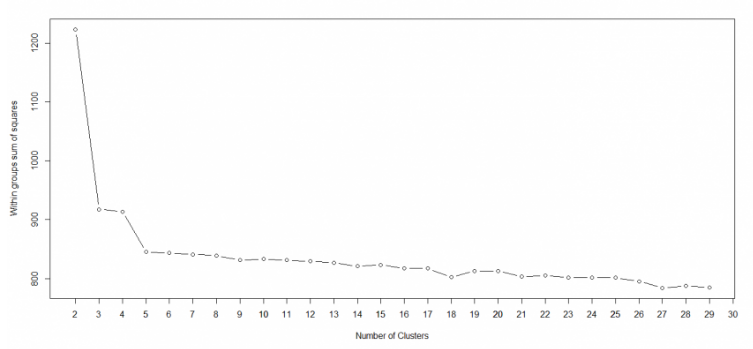
Here, the optimal value for k is shown to be 3, as that is where the SSE decreases abruptly. With k=3, the matrix of tweets was clustered using k-means.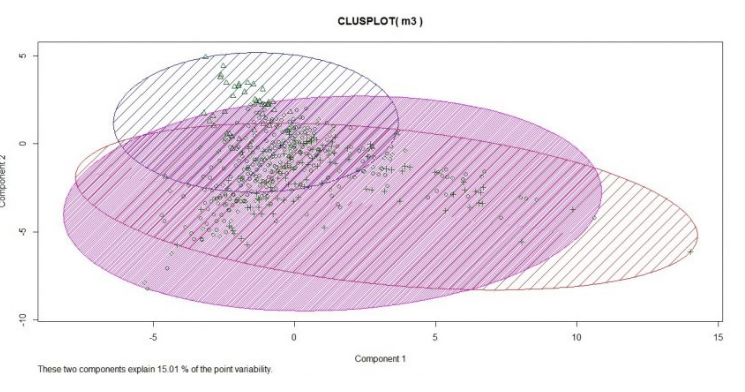
The plot clearly shows that there is only marginal dissimilarity with a corpus at 98% sparsity. This is evident from the top 10 words in each of the three clusters.
cluster 1: rain need status flood helplin number contact stay safe atus
cluster 2: food need contact avail peopl near water area call status
cluster 3: people safe stay flood rain need near road contact media
With respect to clustering, subject matter and corpus knowledge is the best way to understand cluster themes. With the insights gleaned thus far, it is reasonable to assume the following:
Cluster 1 contains news updates and cautionary
Cluster 2 contains messages about requests for help and volunteers
Cluster 3 contains messages about area-specific updates and some cautionary
3.3 Topic Modeling
Another technique that is employed to deduce the themes of text is topic modeling.
A topic model is a type of statistical model for discovering the abstract “topics” that occur in a collection of documents (tweets in this case). Intuitively, given that a document is about a particular topic, one would expect particular words to appear in the document more or less frequently: in this case, ‘help’ is quite common to almost every tweet.
A document typically concerns multiple topics in different proportions; thus, in a document that is 10% about subject A and 90% about subject B, there would probably be about 9 times more words about ‘B’ than words about ‘A’ (Wikipedia, n.d.).
Topic modeling has implementations in various algorithms, but the most common algorithm in use is Latent Dirichlet Allocation (LDA).
3.3.1 Latent Dirichlet Allocation
Latent Dirichlet Allocation (LDA) is a statistical model that allows sets of observations to be explained by unobserved groups that explain why some parts of the data are similar. For example, if observations are words collected into documents, it posits that each document is a mixture of a small number of topics and that each word’s creation is attributable to one of the document’s topics.
LDA allows the possibility of a document to arise from a combination of topics. For example, the following tweet may be classified as (say) 90% information & 10% sympathy/hope.
LDA was performed with an objective to discover 6 topics. The output gives us following set of words for each topic.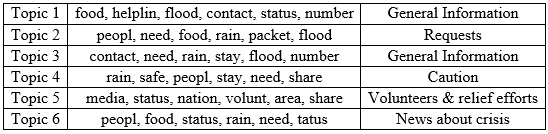
Topics 1 & 3 are quite similar; this is in agreement with the results of the K-means exercise.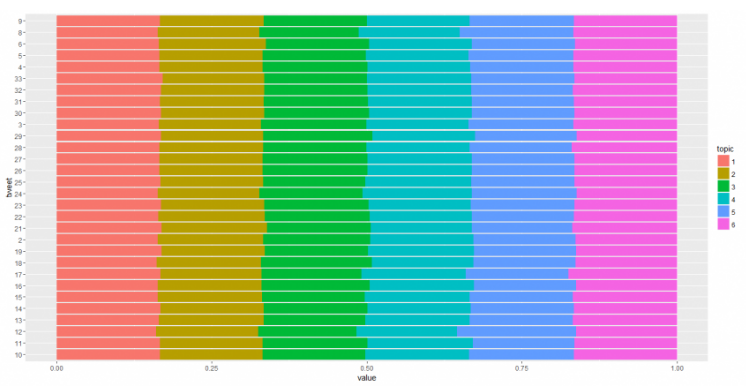
This plot graphs the probability associated with the top 100 words for each topic, sorted from most to least likely. Here too, the lines almost overlap, indicating the content similarity in the tweets.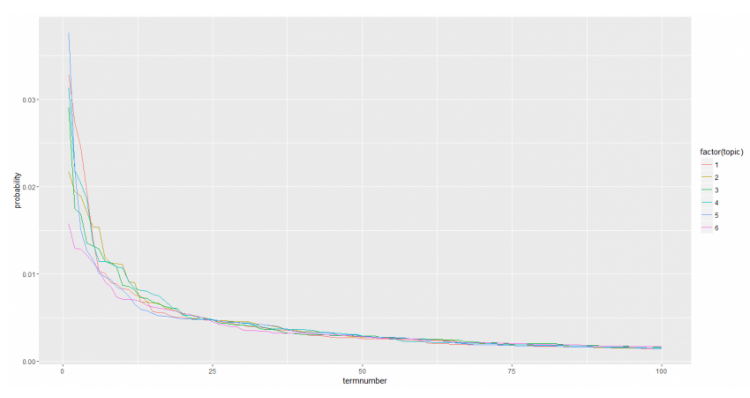
4. Conclusion
It is clear that the general sentiment across the tweets render the tweets quite similar. It has been demonstrated that crucial information like the worst-hit areas can be identified by analyzing tweets and performing basic text analytics.
It is clear that the power of social media can be harnessed to great effect in times of crisis. This has not escaped Twitter’s notice; they have initiated the practice of creating hashtags specific to individual crises to index tweets easily. Facebook launches ‘Mark Safe’ feature to those who have listed a crisis-hit location as their place of residence.
The government agencies, NDRF and other relief agencies would do well to develop analytics capabilities focused on mining Twitter for real-time, tangible updates to take meaningful action.
You can also explore real-world solutions with IT analytics through our blog on the Top 5 Examples of How IT Uses Analytics to Solve Industry Problems.
4.1 Limitations of this study
The study considers only 6000 tweets of the whole set of tweets that would have been sent on the subject.
The study also did not consider captions of pictures, news reports, and other social media reports which could have generated additional insights.
There exist other topic models and black box techniques for similar analysis that have a record of better performance. These have not been performed as they are beyond the scope of this exercise.
4.2 Challenges to Real-Time Analysis of Tweets
The following points highlight a few challenges that will be faced by any researcher trying to solve the same problem.
Retweets contain information that many users find relevant. The subjectivity of this relevance to the crisis at hand is difficult, if not impossible to measure.
This problem is compounded if the tweets contain no hashtags. In the dataset generated for this analysis, 1399 tweets (22%) had no hashtags. These tweets may also be highly relevant to the crisis but may be missed due to the lack of hashtags.
Twitter has a 140 character-limit on all tweets (not including pictures and videos). This leads users to truncate or shorten words to forms that is easily interpretable to humans, but is challenging for a machine. Eg: ‘afcted ppl’ is easily understandable to mean ‘affected people’ for a human, but not for a program. One way to solve this problem is to maintain a dictionary of such terms and match them in real-time.
4.3 Applications & Scope for Further Work
As mentioned in the introductory chapter, this is an active field. The power of social media will continue to be researched and newer applications will continue to be built to harness its power.
One area is quashing rumors. During the Chennai floods, quite a number of false ‘news reports’ and ‘alerts’ circulated on Facebook, Twitter and the mobile messaging application WhatsApp. Machine learning can be employed to check the veracity of social media by comparing contents from actual news reports and
During the 2011 Australia floods, the civic authorities were among the most prolific users of Twitter in disseminating safety tips, general information and coordinating volunteer relief work. Every civic authority would do well to develop a framework and system to manage crises also through social media. This covers all disasters, both natural (earthquakes, floods, hurricanes) and man-made (terror strikes, shootouts).
Media outlets and government agencies can work together in planning for incidents that are expected by creating distinct identifiers and hashtags for each scenario and making the public aware of the
Disasters may strike at any time. While it may not be possible to prevent them, it is prudent to be prepared for unfortunate eventualities. Having a dedicated social network analysis platform to analyze information in real-time will definitely aid in this endeavor.
This article was contributed by Anandhi Venkat, Ashvin Kumar Elangovan, Vignesh Kumar and Vijay Somanath and the mentor Jatinder Bedi and was done as part of their capstone project. They were part of the Great Learning PGP Data Science Course in Chennai and finished their curriculum recently.
Must Read
- What is Computer Vision? Know Computer Vision Basic to Advanced & How Does it Work?
- Types of Neural Networks and Definition of Neural Network
Hear from Our Successful Learners
- A great opportunity to explore and implement concepts – Omkar Sahasrabudhe, PGP AIML
- Great Learning helped express my understanding of new techniques – Capt Karthik, PGP AIFL
- Structured Self-learning videos and mentoring sessions strengthen the understanding of concepts – Anand Venkateshwaran, PGP AIML
- Great Learning videos & sessions are of great use to understand the concepts in-depth – Lenin Christopher, PGP AIML
- Utilizing the skills acquired at Great Learning to address one of the client’s demands – Daniel Raju, PGP AIML
- I planned to implement data-driven approaches with the skills I gained during this course – Vanam Sravankrishna, PGP AIML