
“Data Visualization is better than numeric language as it helps us with a clear picture of the results and requires less effort to build a holistic understanding.”
Executive Summary
Although data science has gone mainstream, many onlookers see it as a fancy word for plain old statistics. But it’s a way for companies to apply analytics by using a technology platform to operate and strategize business more intelligently.
Data science is about deriving insights by viewing data through a mathematical lens. It’s not about math or technology. It’s about finding patterns in the data that can be incredibly useful in a wide variety of business situations.
Regardless of the industry, be it life sciences, financial services, archaeology, retailing, etc., or even internal disciplines such as operations, product development, marketing, etc.; Pattern recognition has shown an impact. It can be brought to bear on numerous use cases, and actionable insights can be discovered one by one. And as someone has rightly said, Data Visualization is better than numeric language. It helps us with a clear picture of the results and requires less effort to build a holistic understanding.
This article will build some understanding and talk about one such application of visualization - Thematic Maps - primarily in conjunction with spatial analysis. We’ll focus first on some basics and then its usage in different industries around us to solve different objectives.
The application of thematic maps in a geospatial context will hopefully illuminate how pattern recognition, when combined with the right visualization, can be applied in various use cases, across industries, in ways that can enlighten leaders with insights to make better-informed business decisions.
Geospatial Analysis and Thematic Maps: Getting Well ‘Grounded’
Before we get into business use cases, it is always good to refresh the basics. So let’s first talk about geospatial analysis and then get into the basics of primary visualization technique - The thematic map and its various types.
At its essence, geospatial analysis is all about determining the relative position of things on the earth’s surface and then deriving understanding from this knowledge.
On the other hand, a thematic map shows the spatial distribution focusing on a theme or topic. The core thing here is the - topic of the theme in focus. What are we trying to focus on, and who is the target audience ultimately drives the outcome. We use different colors or symbols to show differences/patterns in thematic maps.
Recently, we all are seeing so many version of thematic maps during the coverage of pandemic Covid-19.versions
All thematic maps are a combination of base maps (our regular collection of maps, including general-purpose maps) and themes built on top of base maps using colors, symbols, etc., as per the theme/topic we are visualizing. They are handy because many times, you need to understand the spread of “the thing” in focus.
Let’s touch base on some important and popular types of Thematic Maps -
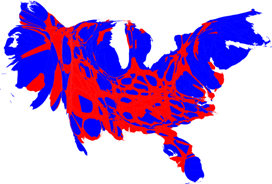
The Choropleth map is the most common type of thematic map. It represents quantitative data using different colors or shades in proportion to show density, percent, or quantity of an event in a geographical area. For example, let’s look at the US county-level map below.
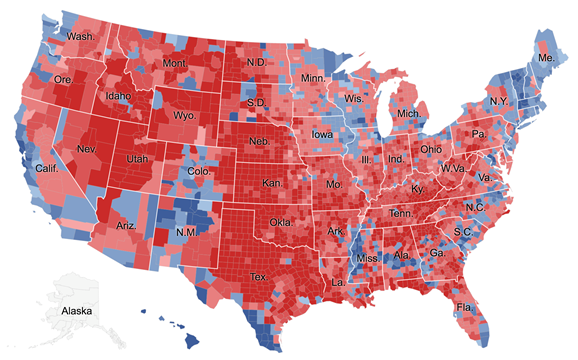
Source - NY times Fig. 1
The US county-level map uses red to showcase population voting for republicans, and blue shade is used for democrats.
Before we move on to next, let’s briefly discuss one important problem with Choropleth’s colour-shaded area. By look, one can say that most of the citizens of the US vote for Republicans. Here, the large geographic regions in the central US are large in areas and not as densely populated as many coastal areas, which are smaller in size. So in these kinds of maps, large size geographical areas might end up dominating the overall visuals. Be wary of these when you are plotting or looking at Choropleths.
Proportional symbol maps or graduate symbol maps are other types of thematic maps used widely. Here, the data is represented by proportionally sized symbols to focus on quantity rather than density. One can get more creative and use a combination of color and size to depict the size/quantity and class/range together in a single representation.
Here is one simple example in Figure 2. Here the size of the dots represents the size of the lead, and color represents the democrats & republicans in blue and red, respectively. More often, these dot sizes are scaled to allow the audience to get close to the actual values as well.

Source - NY Times Fig. 2
Dot density maps use dots to show the presence or occurrence and absence of feature and display a spatial pattern. In dot-density maps, we can use one dot to represent one single thing (one to one dot-density maps) and more than one thing (one to many dot-density maps). The accuracy of placement or position of the dot in the spatial map is very important in one-to-one dot-density maps. These types of thematic maps are known for their simplicity and ease of use. One more important thing to remember in these maps is that the size of each dot is the same. However, one dot can be scaled to represent a bulk (fixed number) of features. Each dot depicts magnitude by frequency.
Fig 3 below showcases the frequency of individuals at one international airport carrying smartphones with e-wallet apps in it. We can see how easily a customer position can be represented by geospatial data derived simply from the devices people carry around with them.
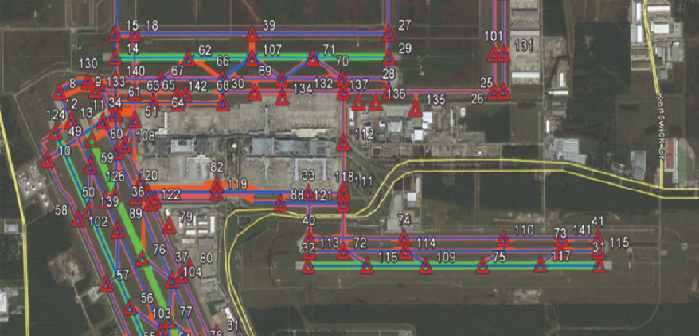
Source – woolpert Fig. 3 *
Heat maps are another type of thematic map to measure density across a map using shades of color. They are similar to the Choropleth map in using color, but unlike Choropleth maps, heat maps don’t use geographical boundaries. Heat maps are often used in scenarios where data represented is not confined to geographical boundaries. Below figure 4 shows confirmed Covid-19 cases on a global map.
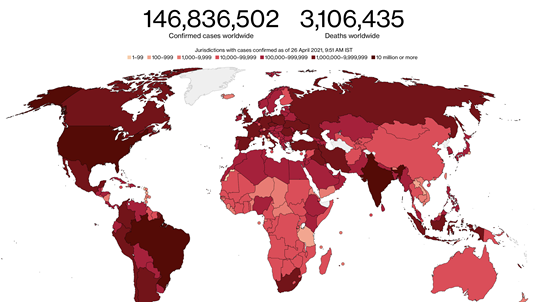
Source - Bloomberg Fig. 4
Tracking a weather pattern, climate change, pandemic (as above) can be better understood when traditional geographical boundaries are removed and hence the heat maps.
Cfeaturesontour maps or Isarithmic maps is another important type. Data for these types of maps are generally gathered via measurable points. They are also called isoline maps because of the one rule they follow - there is a high side and low side in relation to the isoline. They depict continuous quantitative fields as precipitation or elevation by partitioning space into regions.

Source - Wikipedia Fig. 5
Cartogram is a special thematic map and used only for exceptional cases. Unlike Choropleth, here, the size of the area is rescaled to be proportional to the feature it represents. They generally are found to be extensively used by media in election coverage. In fig. 1 at the beginning of the article, we noticed that sometimes the Choropleth visualization gives a wrong impression as large areas dominate the visualization. This weakness is removed in Cartogram thematic maps. The primary drawback of these maps though is that they are difficult to interpret unless the map reader knows the exact geographical shapes of the map units to be related to the actual maps and place it represents.
Fig. 6 below shows one such powerful usage of these maps and its comparison with Choropleth. The one on the left is similar to Fig 1 discussed under Choropleth. The one on the right is represented using Cartogram thematic map where the population rather than the size depicts the area.

Source - Mark Newman Fig. 6
The cartogram map is difficult to generate and requires special tools, skills and hence not used by everyone.
Also Read: Data Wrangling
Thematic Maps - Cross-Industry Use Cases
No matter what you do in today’s world, it has to have some business benefits. Over a period of time, with the advent of new technologies, including but not limited to Wi-Fi, GPS, RFIDs, Mobile for triangulation, AIS (Automated Identification systems), the availability of geospatial data has become so commonplace and inexpensive that we see the uses of Thematic maps in many different areas.
Thematic maps are traditionally used in weather-related activities. Some common examples are -
- To understand the average distribution of rainfall in an area (Fig 7 below)
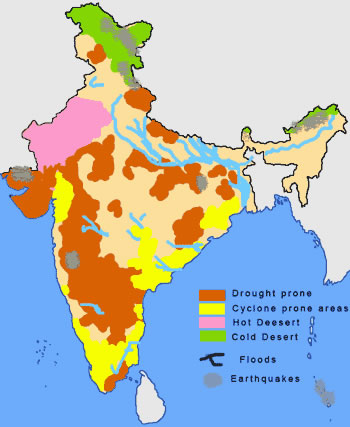
- To understand natural hazard pattern in a geographical area (Fig 8 below)
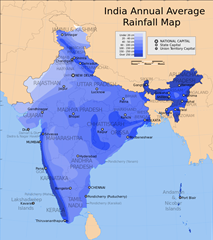

Fig. 7 Source - Maps Fig. 8 Source - wiki
These traditional use cases help the area experts understand the distribution pattern easily and help plan the mitigation, growth, and development plan. For example, rainfall distribution maps help plan the water management, crop management effectively, and natural hazard maps help plan effective crisis management procedures and help decide on managing the natural resource effectively.
Another traditional use case is to stratify the land area based on forest vegetation type.
Some off-beat areas where thematic maps are effectively used are -
- Military and Border Security - thematic maps help with terrain analysis that enables the military to understand the operational environment and its constraints. Thus maximizing the potential for offensive/defensive actions. Thematic maps help the security forces understand the climate/environmental change and realize its impact on ongoing conflicts
- Agriculture - Precision Agriculture is an area of interest where thematic helps users identify the spatial distribution of geographical attributes, plant productivity, and soil. It helps in decision making and better yield with minimal environmental impact 1
Thematic maps are acting as special tools in some of the top Noble work around the globe
- Deployment maps and topographic maps are routinely referred during United Nations Security Council for the planning of peace operations and special political mission’s deployment 2
- United Nations uses these maps as a tool to communicate on the status of human rights and related violations worldwide. It is increasingly used to document, analyze and visualize evidence to ascertain human rights violations and atrocities 2
- Thematic maps are very often used to understand the demographics of your population and then decide and redirect industry growth, employment generations programs accordingly
- Thematic maps are used a lot for facilities and resource management by various government bodies and industrial groups. One such possible use case for “mapping of fisheries infrastructural facilities in greater Mumbai region” is listed in a paper published by authors from Central Institute of Fisheries Education, Mumbai 3
- The maps are being used for monitoring and managing natural resources. In one such initiative, it is used for Monitoring and Managing Africa's water resources 4
- These maps are widely used to understand the damages or disturbances caused by natural calamities and phenomena. In one such case, radar images from the satellite have been used to map the rupture caused by the earthquake in NC, USA 5
As we read above from just a few examples cited above, it is not just one industry or one specific area where thematic maps are used. Still, thematic maps have potential and importance in different areas and industries. Thematic maps are combined with other advanced technologies to identify causation and derive a lot more meaningful insights.
Let’s talk
- What other areas can you think of where thematic maps can do wonders? It may be to understand the origination of digital attacks, identify software security lapses by region, or plot the bot traffic source. Possibilities are endless. The real benefit of the existing method often comes from the industry/area where it was never used, and the method was never even intended for such use. It is the power of thinking.
- Share some unique usage of thematic maps you have come across or can think of. Sharing knowledge helps improve your knowledge, Isn’t it?
- Just a representation and not actual data
Take a look at our data science course and learn data science and analytics from UT Austin McCombs School of Business Faculty and power ahead in your career.


