Today, businesses rely heavily on data-driven decisions to improve operational efficiency, allay risk, improve customer experience, identify and predict trends. With the plethora of data being generated each day across various sectors, it would be safe to assume that the demand for skilled data analysts will rise in the coming years, making it one of the most sought-after professions in the job market.
The role of a data analyst includes collecting relevant data from primary and secondary sources, data cleansing, interpreting, analyzing results using statistical techniques and communicating the results effectively to the stakeholders. From the above, we can see that a data analyst’s job is not one skill profession. Apart from programming, skilled data analysts are expected to have a fair understanding of statistical concepts and should be effective communicators.
Statistics Course for Data Science and Analytics
Learn statistical methods crucial for data science, including regression and hypothesis testing, to extract valuable insights from data.
Also Read: Salary Trends of Data Analysts in India
Preparation is the key to land a desired job. To help all the aspiring data analysts with their interview preparations, we have listed down a set of questions and answers which is further categorized into the following sections –
- Questions and Answers – Data Science
- Questions and Answers - Statistics
- Questions and Answers – Modelling and Programming
Questions and Answers – Data Science
1. What are the key responsibilities of a data analyst?
The roles and responsibilities of a data analyst can vary depending on the company or domain. However, the typical responsibilities of a data analyst include, but not limited to:
- Data collection and processing
- Analyzing data
- Data mining
- Finding patterns and trends
- Creating Reports
- Maintaining databases
Start with data analytics—no experience needed. Learn the fundamentals and make smarter decisions at work.
2. Enlist and explain the steps of a Data Analytics project lifecycle.
The following are seven fundamental steps of a data analytics project –
- Problem Definition: Defining the problem is the first step of a data analytics project which aims at understanding the given problem at hand.
- Data Collection: The process of gathering and measuring information on different attributes of interest is called data collection.
- Data processing: A series of steps performed on the collected data to verify, organize, transform and integrate data in an appropriate format for further analysis.
- Exploratory Data Analysis (EDA): EDA is a process that employs a variety of techniques that helps the analyst to get familiar with the data.
- Modelling: In this step different statistical modelling methods can be used to make predictions about the future.
- Data Visualization: Data visualization is used to deliver visual reporting to users to understand the model performance and prediction.
- Communicate Results: The last step of the data analysis lifecycle is communicating our findings to the stakeholders.
3. Name some of the best tools used for data analysis and data visualization.
Below are some of the best tools for data analysis and data visualization –
Tools for Data Analysis:
- Python
- R Programming
- SQL
- SAS
- Apache Spark
Tools for Data Visualisation:
- Tableau
- QlikView
- PowerBi
- QlikSense
Data Visualization using Power BI
Learn how to transform raw data into meaningful insights with Power BI. This course covers essential visualization techniques to help you create compelling, interactive dashboards and reports.
Also Read: How to Become a Data Analyst
4. What are the different methods of data collection?
The data collection techniques can be broadly classified into two – Primary Research and Secondary Research
Primary Research: Primary research is the process of gathering first-hand information through self-conducted research methods. However, it is worth noting that primary research is a resource and time-intensive process. Some of the common primary research techniques include:
- Personal Interview with Questionnaire
- Mailed Questionnaire
- Surveys
Secondary Research: Secondary research is the process of gathering information that already exists in the public domain. This is the most preferred research process as it is both fast and cost-efficient. Some of the common secondary research sources are as follows –
- Company Reports – Annual reports, Financial statements etc.,
- Press Releases
- Published market reports
- Journals
- Magazines
- Articles from news publishing houses
5. What are the precautions to be taken while collecting secondary data?
It is important to evaluate the secondary data and ensure that it satisfies the following characteristics:
- Assess if secondary data being collected is relevant to the specific problem under study
- Examine the data quality based on accuracy and completeness.
- Ensure that the data is reliable and unbiased.
6. How should a data analyst handle missing or null values?
One of the following methods can be applied while handling missing values, depending on the nature of the data and data type we are working with
- Drop Rows with more than 50% missing values
- Impute missing values with central tendency measures such as mean or median
- For categorical attributes, impute missing values with the most frequent category (mode)
- Predicting the missing values with regression or classification models
- Using machine algorithms such as K-NN that supports missing values while making a prediction
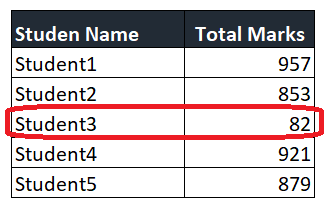
7. What is an Outlier?
An outlier is an observation that deviates significantly from other observations or visibly different from other data points. It is important to detect and remove outliers before using the data for further analysis, as it can lead to inaccurate or distorted results.
As shown in the example below, the total marks obtained by Student3 is a clear outlier, as it is far from other observations in the table. If this observation is not detected and removed, it would negatively impact the overall output.
8. What is Data Cleansing? Explain some of the best practices of the Data Cleansing process?
Data cleansing is one of the most critical steps of data mining. The process ensures that the data is clean and ready for further analysis.
Some of the best practices of the data cleansing process are as follows:
- Data Redundancy: Identifying and removing duplicates from the data sets
- Irrelevant Data: Getting rid of attributes that are not relevant in solving a specific problem
- Standardization: Ensure that the data is in a standardized and accessible format.
- Data Integrity: Identifying and fixing common errors such as inaccuracy, invalid data, incorrect data entry, missing values, spelling errors, incorrect data ranges.
9. What is DBMS? Explain its characteristics?
A Database Management System (DBMS) is a software system used for storing and retrieving interrelated data conveniently and efficiently.
Main characteristics of data in DBMS:
- Data sharing: Data can be shared between different users and applications
- Data independence: Changes made in the database schema at one level should not affect other levels.
- Controlled redundancy: Data is not duplicated, however, any duplication is on purpose and controlled.
- Data Integrity: Data entered should be correct, complete, and consistent.
- Data Security: Data is made accessible only to authorized users.
10. What is a Data Warehouse?
A data warehouse is a repository that stores large amounts of data from different sources across the business. It provides a centralized view of all data being collected and is designed to carry out analytics, business intelligence and data mining activities.
Following are some of the characteristics of a data warehouse –
- Structured and Standard Format: Data warehouse uses the process of extraction-transformation-load (ETL) to ensure that the data loaded to the system is in a structured and standard format.
- Time-Variant: Data loaded into the data warehouse receives a time stamp, thereby facilitating comparison between different periods.
- Non-operational and Non-volatile: Data warehouse uses a copy of data from the live database. Once loaded the data remains unchanged.
11. What is Big Data? Name some of the Big Data technologies?
Big Data as the name suggests is a collection of large amounts of both structured and unstructured data. Managing and processes such a huge set of data is beyond the purview of traditional relational databases. Big data technologies are designed to analyze and process these complex data sets.
Some of the most popular big data technologies are listed below:
- Hadoop Ecosystem
- Artificial Intelligence
- Apache Spark
- NoSQL Database
- Data Lakes
- In-Memory Database
12. Explain univariate, bivariate, and multivariate analysis.
- Univariate analysis: Univariate is a form of data analysis where a single variable is analyzed to describe and find patterns that exist within it. It is the simplest form of data analysis as it doesn’t deal with causes or relationships.
- Bivariate Analysis: Bivariate analysis measures the correlation between two variables. This technique is used by researchers when they aim to draw comparisons between two variables.
- Multivariate Analysis: Multivariate analysis is used to study complex data sets. In this form of analysis, a dependent variable is represented in terms of several independent variables observations available to establish such a relationship.
13. Explain Data Visualisation and its importance in data analytics?
Data Visualisation is the graphic or pictorial representation of data. In other words, data visualization provides a visual summary of the data at hand.
Some of the importance of Data Visualisation is listed below:
- Helps in absorbing information quickly
- Easy to spot patterns and trends
- Finding outliers
- Memorizing important insights
- Helps in sharing insights effectively
- Helps in engaging audience
14. Explain Scatterplots.
Scatterplots are a simple and effective tool for data visualization. A scatterplot is used to understand the relationship between two variables. Each dot in a scatter plot represents values of the x-axis versus the y-axis. For example: each dot of a scatter plot with weight on the x-axis and height on the y-axis represents the relationship between the weight and height of a particular person.
15. Explain histograms and bar graphs.
- Histograms: Histogram is the most commonly used method to represent frequency distribution. A histogram is a series of vertical bars having areas that are in the same proportion as the frequencies of a frequency distribution. The class intervals of the variables are shown on the horizontal axis (x-axis) and the frequencies of the class intervals are shown on the vertical axis (y-axis).
- Bar graphs: Bar graphs are the most popular and commonly used form of graphical representation. It is used to represent the values of categorical data on charts. A bar graph can be plotted either vertically or horizontally. In a vertical bar graph, the categories are shown on the horizontal axis (x-axis) and their corresponding values are shown on the vertical axis (y-axis).
16. How is box plot different from histograms?
Both boxplots and histograms are used to show the distribution of data, however, they depict different information.
Boxplots are also known as box and whiskers plot, and are more suited to provide a visual depiction of the range of the data, the mean, the interquartile ranges. Boxplots provide a summary of variation in large datasets. It also helps to detect outliers present in the data being analyzed.
Histogram is a series of vertical bars having areas that are in the same proportion as the frequencies of a frequency distribution. The class intervals of the variables are shown on the horizontal axis (x-axis) and the frequencies of the class intervals are shown on the vertical axis (y-axis). The histogram helps to understand the spread of the data, see if the data is symmetric or skewed, and also identify outliers in the data.
17. What is Machine Learning?
Machine Learning is an application of Artificial Intelligence (AI) that trains machines to learn from historical data and develop its capability to predict an outcome for the future. Machine learning has wide application across different industries such as healthcare, financial services, e-commerce, automotive to name a few.
18. What are the different types of Machine Learning?
Machine Learning can be categorized into the following three types –
- Supervised Learning: In Supervised learning is a task-oriented learning type where the system is trained using historical data, which further develops the ability to predict outcomes for new instances. Supervised learning is predominantly used to resolve classification and regression problems. Classification is used for predicting a class label whereas regression is used for predicting a numerical label.
- Unsupervised Learning: Unlike supervised learning, unsupervised learning doesn't have any supervisor to teach the system. It functions on huge sets of data with no knowledge of target variables. The machine learns by grouping the input data based on patterns and similarities. Two prominent types of unsupervised learning are clustering and density estimation. Clustering is used to solve problems by grouping the data, on the other hand, density estimation summarizes the distribution in data.
- Reinforcement Learning: In reinforcement learning, decisions are made by the system based on the feedback it receives for its actions. In this approach, the algorithm learns from its mistakes and improvises to return better results, over time.
Questions and Answers – Statistics
19. What is the difference between population and sample?
Population refers to the entire set of elements such as people or objects on which we intend to conclude. In other words, it can be termed, the universe.
Sampling refers to the subset of a population. Sampling creates an understanding of the entire population based on the results obtained from the sample.
20. Best practices of sample selection?
Sampling is one of the most crucial steps of data analysis as it influences the accuracy of results to a great extent.
Below are some of the best practices for sample selection:
- Sample size: The size of the sample should be large enough to ensure that the inferences drawn from it are reliable.
- Representative: Since the sample is a subset of the entire population, it should be selected in such a way that it closely represents the characteristics of the population from which it is drawn.
- Minimizing bias: The sample chosen from the population should be influenced by any factor, in other words, it should not be biased.
21. What is sample selection bias?
Sample selection bias is a type of bias that is caused when non-random data is chosen for statistical analysis. By choosing non-random data, we might end up excluding a subset of the data that can influence the statistical significance of the test.
22. Differentiate descriptive and inferential statistics.
- Descriptive Statistics: Descriptive statistics provide information about the data under study. It describes the characteristics of data using central tendency measures such as mean, median, variation, and mode; measures of variance such as range and standard deviation.
- Inferential Statistics: Inferential statistics is concerned with the estimation of population values. Based on the inferential analysis, the task of drawing inferences and conclusions is done.
23. Explain Linear and non-linear correlation.
The distribution between linear and non-linear correlation is based upon the ratio of change between the variables.
- Linear correlation: Linear correlation exists when the ratio of change between two variables is constant. In a linear correlation, a straight line can pass through the data points.
- Non-linear correlation: Non-linear correlation exists when the ratio of change between two variables is not constant. The best fit line along the data points represents a curve.
24. Explain which central tendency measures to be used on a particular data set?
The following points should be considered, we need to use the most appropriate measure of central tendency.
- Mean is useful when the data set has no extreme values in the data set.
- Median is preferred over mean when there are extreme values in the data set.
- Mode is useful in finding the most common item or value of a data set.
25. What is the five-number summary in statistics?
The five-number summary is useful in descriptive analysis and includes the following five elements:
- The Minimum – smallest value in the data set
- The First Quartile – 25% mark, which is denoted by Q1
- The median – the middle value in the data set, when sorted in an ascending order
- The Third Quartile – 75% mark, which is denoted by Q3
- The maximum – biggest value in the data set
26. Explain the Interquartile range.
The interquartile range is similar to the normal range, except that in this method the range includes only the middle 50% observations from the entire distribution. In other words, one-quarter of the observation at the lower end, another quarter of the observation at the upper end of the distribution are excluded in computing the interquartile range. The interquartile range can be defined as the difference between the third quartile and the first quartile.
The interquartile range is calculated using the below formula,
Interquartile range = Q3 - Q1
Where,
Q3is the third quartileQ1is the first quartile
27. What is linear regression in statistics?
Linear regression establishes a relationship between two variables by finding a best-fit linear equation. One of the variables is considered as an independent variable and the variable to be predicted is considered as a dependent variable.
A simple linear regression with one dependent and one independent variable can be expressed as:
y = mx + c
where,
yis the dependent variablexis the independent variablemdenotes the regression coefficientcis the constant
28. What do you understand by Variance and Covariance?
Variance, as the name suggests measures the variability of observations in a given data set. It determines how far an observation is from the mean. Variance can be calculated using the below steps –
- Calculate Mean
- Subtract each observation with mean and square the result
- Take an average of the squared differences.
Covariance on the other hand is a measure of how two variables vary with each other. A positive covariance indicates that the values of the variables are increasing in the same direction, whereas, a negative covariance indicates that the variables are moving in the opposite directions.
29. What is correlation?
A correlation indicates the degree of relationship between two variables. It measures both strength and direction of the relationship.
Also Read: Difference Between Covariance and Correlation
31. Distinguish between positive and negative correlations.
- Positive Correlation: When two variables move in the same direction then the correlation between these two variables is said to be a positive correlation. When the value of one variable increases, the value of the other variable also increases at the same rate.
- Negative Correlation: In this type of correlation, the two variables move in the opposite direction. When the value of a variable increases, the value of the other variable decreases.
32. What is Range?
Range is the simplest way of studying dispersion. It is defined as the difference between the value of the largest item and the value of the smallest item present in a given data set.
Range is calculated using the below formula:
Range = L – S
Where,
Lis the largest itemSis the smallest item
33. What is Mean Deviation?
The mean deviation is also known as the average deviation. It is the average difference between the items in a distribution and the central tendency measures such as the mean or median of a particular data series. It is termed as mean deviation as it uses the arithmetic mean for calculating the value of the average deviation
34. What is the standard deviation?
The standard deviation measures dispersion. The greater the standard deviation, the greater will be the magnitude of the deviations of the value from their mean. A lower standard deviation indicates a greater degree of uniformity of the observations.
35. What is the normal distribution and explain its characteristics?
The normal distribution refers to continuous probability distributions represented as a symmetrical bell-shaped curve.
Normal distribution possesses the following characteristics:
- Continuous Random Variable.
- Bell-shaped curve.
- The normal curve extends indefinitely but never touches the horizontal axis.
- The measures of central tendency - mean, median, and mode are equal
- 50% of the data under the curve lies to the left of the mean and the other half to the right of the mean.
- 68% of the area under the curve falls within one standard deviation of the mean
- 95% of the area under the curve is within two standard deviations of the mean
- 99.7% of the area under the curve is within three standard deviations of the mean
- The total area under the normal curve is equal to 1
Post Graduate Program in Data Science
Master data science skills with a focus on in-demand Gen AI through real-world projects and expert-led learning.
Questions and Answers – Modelling and Programming
36. What do you understand by Overfitting and Under-fitting models?
Overfitting models are the ones that work best on the training data, but fail to perform well on the test data. The reason why it works well on the training data and poorly on test data is that it models the noise in the training data as well.
Underfitting models are those which don't work well on the training data as well as the test data. In other words, it fails to identify the underlying trend in the data. This happens when we try to build a model on a lesser amount of data or when we try building a linear model with non-linear data.
Both overfitting and underfitting models should be avoided as they result in poor accuracy.
37. What are the differences between regression algorithm and classification algorithm?
| Regression Algorithm | Classification Algorithm |
|---|---|
| The output variable must be a continuous value | The output variable must be a discrete value. |
| The regression algorithm tries to map the input value with the continuous output variable. | The regression algorithm tries to map the input value with the discrete output variable. |
| In regression, output is predicted by finding the best fit line | In Classification, output is predicted by dividing the data into different classes |
| Can be Linear and Non-linear Regression. | Can be Binary and Multi-class Classifier. |
| Regression algorithms can be used to solve the regression problems such as sales and weather prediction, etc. | Classification Algorithms can be used to solve classification problems such as spam detection, Identification of cancer cells, sentiment analysis etc. |
38. What is logistic regression?
Logistic regression is a classification algorithm that is used when we are doing predictions on a binary outcome. When the output can have only two possible scenarios. Some of the examples of binary out are - yes or no, true or false, 1 or 0, low or high. It finds out probabilities for a data point belonging to one of the two possible classes.
39. What are the differences between k-NN and k-means clustering?
| K-NN | K-Means |
|---|---|
| K-NN represents a supervised machine learning algorithm | K-means represents an unsupervised machine learning algorithm |
| K-NN is a classification or regression machine learning algorithm | K-means is a clustering machine learning algorithm |
| The target variable is known beforehand | The clusters are unknown |
| Known as a lazy algorithm as it works by memorizing the training data | K-Means algorithm is an eager learner |
40. Mention some disadvantages of the linear model
Following are some of the disadvantages of the linear model:
- Linear regression assumes that a straight line (linear) relationship between variables
- Outliers can hugely impact linear regression models
- The linear model can end up being an overfitting model, especially when there are too many attributes compared to the sample size.
- The Linear model assumes that there is no multicollinearity in the data.
41. Explain clustering in machine learning?
Clustering is a technique that works by dividing data points into groups. The grouping is done based on a similarity between the data points in such a way that all the groups are significantly different from each other. A few types of clustering are Hierarchical clustering, K means clustering, Density-based clustering, Expectation-Maximization (EM), Clustering, etc.
42. What are the different types of clustering algorithms?
Some of the common clustering algorithms are as follows –
- Hierarchical clustering
- K means clustering
- Density-based clustering
- Fuzzy Clustering
43. What are the various classification algorithms?
Some of the common classification algorithms are as follows –
- Logistic Regression
- Naive Bayes
- Decision Tree
- Random Forest
- Support Vector Machine
44. How do you find Root Mean Square Error (RMSE) and Mean Square Error (MSE)?
Mean Square Error (MSE) is calculated by adding squared (actual value-predicted value) for all data points and dividing it by the number of instances, which gives an estimate of the average of the total square sum of errors.
Root Mean Square Error (RMSE) is similar to mean square error (MSE), but in this case, the square root of the squared sum of errors is considered.
45. What are the built-in functions of Python?
Below is a comprehensive list of all the built-in functions in Python
| abs() | delattr() | hash() | memoryview() | set() |
| all() | dict() | help() | min() | setattr() |
| any() | dir() | hex() | next() | slice() |
| ascii() | divmod() | id() | object() | sorted() |
| bin() | enumerate() | input() | oct() | staticmethod() |
| bool() | eval() | int() | open() | str() |
| breakpoint() | exec() | isinstance() | ord() | sum() |
| bytearray() | filter() | issubclass() | pow() | super() |
| bytes() | float() | iter() | print() | tuple() |
| callable() | format() | len() | property() | type() |
| chr() | frozenset() | list() | range() | vars() |
| classmethod() | getattr() | locals() | repr() | zip() |
| compile() | globals() | map() | reversed() | __import__() |
| complex() | hasattr() | max() | round() |
46. What is slicing?
Slicing in Python returns a subset of elements from sequence types such as strings, list, tuple, etc. based on their indices
x = [5, 7, 9, 11, 13]

x[0:3] will return [5,7,9]

x[2:] will return [9,11,13]
47. What is indexing in Python?
The sequences in python such as lists, tuple, strings can be indexed in both positive and negative numbers.
For positive index, the indexing starts with 0 (first index), followed by 1 (second index) and so on.
For negative indexes, the indexing starts with -1, which is used to access the last element of the sequence, followed by -2 and so on.
48. How can you convert a number to a string and vice-versa in python?
Python has an in-built function str() which can be used to convert a number into a string.
Example: x = str(7.5)
To convert a string to python we can use the in-built function int().
Example: x = int(“15”)
49. What is the range function in python?
The range() is an in-built function of python that generates a sequence of numbers by specifying the end number in the function. It starts from 0 and increments by 1, ends before the number specified in the function.
For example:
for i in range(9):
    print (i)
The output is 0, 1, 2, 3, 4, 5, 6, 7, 8
50. What are lambda functions?
A lambda function is known as an anonymous function, as it has no function. A lambda function can have only one expression but can take any number of arguments.
51. What are the advantages of R programming?
Some of the advantages of R are as follows –
- R is a freeware
- R has an active and huge community to provide help online
- R can perform multiple operations at once as it is a vector language
- R is an interpreted language, hence doesn’t require an interpreter
- R programming is the best programming language for statistical analysis
- R programming provides many inbuilt functions for Data Science applications
52. Briefly describe different data structures in R?
The most common data structures in R are as follows –
| Data Structure | Brief |
|---|---|
| Vector | A vector is a one-dimensional sequence of data elements of the same data type. |
| List | Lists can contain elements of different data types such as − numbers, strings, vectors, etc. |
| Matrix | A matrix is a two-dimensional array of elements of the same data type. Vectors of the same length can be combined to form a matrix. |
| Dataframe | A data frame is similar to the matrix, however, different columns in a data frame can have different data types such as - numeric, strings, logical, etc. |
53. What are different packages used for loading data in R programming
- DBI: this package is used for communication between R and relational database management systems (RDMS).
- RMySQL, RPostgreSQL, RSQLite: Depending on the type of database, we can choose one of these packages to read the data from a database.
- XLConnect, xlsx: helps to read and write MS Excel files
- Foreign: used to read SAS or SPSS data sets. The foreign package provides functions that help in loading data files from other programs into R.
54. Name a few packages used for data manipulation in R programming?
- Dplyr: this package is useful in summarizing, rearranging, and joining together data sets.
- Tidyr: helps in changing the layout of the data sets. It is used to convert the data into a tidy format.
- Lubridate: helps in working with date and time.
55. Name a few packages used for data visualization in R programming?
- ggplot2: ggplot2 uses the grammar of graphics to build layered, customizable plots.
- Ggvis: creates web-based graphics.
- Rgl: creates interactive 3D visualizations.
56. What are different packages used in R programming for data modeling?
- lme4/nlme: used in linear and non-linear mixed-effects models
- mgcv: generalized additive (mixed) Models
- randomForest: used to create and analyze random forests
- multcomp: used for multiple comparison testing
- survival: used for survival analysis
- caret: used for training regression and classification models