- What is Data Analytics?
- Types of Data Analytics
- How to Use Data Analytics?
- Data Analysis Tools and Techniques
- Applications of Data Analysis
- Benefits of Data Analytics
- Difference Between Data Analytics and Data Science
- Difference Between Data Analytics and Big Data Analytics
- Data Analytics Case Study
- A Career in Data Analytics
- Future of Data Analysis
- Conclusion
This article explores various aspects of data analytics and the skills needed to excel in the field. The information will take you through the basics of data analytics to get you started and highlight the pros and cons of each topic.
What is Data Analytics?
Data analytics is the process of turning unprocessed data into insightful knowledge that can be put to use. Consider it a type of business intelligence employed to address particular issues and difficulties a firm faces. Finding patterns in a dataset can inform you about specific aspects of the business, such as customer behavior or why sales decreased during a specific period.
A data analyst examines raw data to glean valuable insights. Then, to help stakeholders comprehend and act on these insights, they display them in visualizations, such as graphs and charts. Finally, the analysis used will determine the insights that can be drawn from the data. Experts in data utilize four primary forms of research:
- Descriptive
- Diagnostic
- Predictive
- Prescriptive
Descriptive analytics investigates past events, while diagnostic analytics focuses on potential causes. Finally, analytics that make predictions and recommend the best course of action are known as predictive and prescriptive analytics.
Consequently, data analytics helps analyze historical data and the projection of future trends and behaviors. As a result, instead of basing your strategies and decisions on conjecture, you are making educated decisions based on what the data tells you.
Businesses and organizations can make decisions, plan, and compete in their target markets with a data-driven approach. This allows them to gain a much deeper understanding of their audience, industry, and firm.
Start with data analytics—no experience needed. Learn the fundamentals and make smarter decisions at work.
Types of Data Analytics
The field of data analytics is vast. The four main categories of data analysis are descriptive, diagnostic, predictive, and prescriptive analytics. Each category has a distinct objective and function during the data analysis process. These are also the main applications of data analytics in business.

Descriptive analytics aids in providing explanations for events. These methods condense big datasets into concise summaries that stakeholders can understand. These tactics help develop key performance indicators (KPIs), which monitor success or failure. Many sectors employ metrics like return on investment (ROI). Performance in particular industries is tracked using technical measures. This procedure calls for gathering pertinent data, data processing, data analysis, and data visualization. This procedure offers crucial knowledge about previous performance.
Finding the causes of occurrences is aided by the diagnostic analysis. These techniques provide more detailed insights into descriptive analytics. To identify the underlying cause, they carefully evaluate the descriptive analytics results. Typically, three processes are involved in this:
- Find unusual patterns in the data. These adjustments could be sudden shifts in a statistic or a specific market.
- Data on these anomalies is gathered.
- Finding links and patterns that explain these anomalies requires the application of statistical tools.
Future-related issues can be answered with predictive analytics. These methods use historical data to spot trends and assess their likelihood of repetition. Predictive analytical tools, which use various statistical and machine learning techniques, such as neural networks, decision trees, and regression, offer insight into potential future events.
Prescriptive analytics provides recommendations for action. Predictive analytics insights can be used to make data-driven decisions. In the face of uncertainty, this enables firms to make wise judgments. The foundation of prescriptive analytics tools is machine learning algorithms that can identify trends in massive datasets. Studying previous decisions and events is possible to assess the chance of various outcomes.
These kinds of data analytics give organizations the knowledge they need to make wise decisions. Together, they offer a comprehensive insight into a company’s needs and potential.
How to Use Data Analytics?
Data analytics can be utilized by any company that collects data, and its application will vary based on the situation. In general, data analytics is employed to facilitate wiser business choices. This aids in lowering total corporate expenses, creating better goods and services, and streamlining organizational procedures and operations.
For example, data analytics may be used to predict future sales and purchase behaviors by detecting past trends. It could be used for security objectives, such as identifying, anticipating, and stopping fraud, particularly in the insurance and financial sectors. It can be applied to improve audience targeting and personalization and analyze the success of marketing campaigns. Data analytics is also used in the healthcare industry to discover the best course of therapy or care for each patient and to produce faster, more accurate diagnoses. Data analytics also improves everyday business processes by locating and removing bottlenecks in particular workflows.
Almost every industry uses data analytics, including marketing, advertising, healthcare, travel, logistics, finance, insurance, media, and entertainment. For example, consider the individualized recommendations you receive from services like Netflix and Spotify, which results from data analytics.
Data Analysis Tools and Techniques
Before we go through some fundamental data analytics methodologies, let’s quickly distinguish between the two types of data you might deal with: quantitative and qualitative. Quantitative data includes anything that can be measured, such as the total sales for a particular year or the percentage of survey respondents who said “yes.” Comparatively, qualitative data is unmeasurable and includes things like what people say in interviews or the content of emails.
Data analysts often work with quantitative data, but some positions also call for you to gather and analyze qualitative data, so it’s beneficial to be familiar with both. With this in mind, here are some of the most popular data analytics methods:
- Regression analysis: This technique is used to model or estimate the relationship between different variables. This analysis can be used to determine certain variables and accurately predict other variables. Regression analysis is mainly used to make predictions. However, regressions alone cannot provide any information on cause and effect; instead, they can only be used to determine whether a group of variables is connected.
- Factor analysis: This method, also known as dimension reduction, aids data analysts in identifying the underlying factors that influence people’s behavior and decision-making. In the end, it reduces the data from numerous variables into a small number of “super-variables,” making the data more manageable. Factor analysis can be used, for example, to combine three separate variables representing different aspects of consumer satisfaction into a single, comprehensive score.
- Cohort analysis: A cohort is described as a collection of users who share a particular attribute throughout a specific period; for instance, all consumers who made purchases in March using a mobile device may be grouped as a single cohort. Cohort analysis divides customer data into smaller cohorts so businesses can identify trends and patterns across time that pertain to specific affiliates rather than considering all customer data equally. Therefore, companies can provide a more specialized service after spotting these trends.
- Cluster analysis: This method aims to locate structures in a dataset. In essence, cluster analysis divides the data into groups that are internally homogeneous and outwardly diverse; in other words, the items in a cluster must be more similar to one another than they are to the items in different sets. When there are no predetermined groups or categories of the data, cluster analysis allows you to see how the data is spread across the dataset. Cluster analysis can be used in marketing, for instance, to pinpoint specific target markets into a broader client base.
- Time-Series Analysis: Time-series data are data points that measure the same variable over time. Therefore, time-series analysis is gathering data at regular intervals to spot trends and cycles that help data analysts make predictions for the future. For example, time-series analysis can examine how the demand for a given product appears typically at different times to forecast the future market for that product.
We’ve only touched the surface of what each technique entails and how it’s applied. These are just a handful of the many strategies that data analysts will employ.
Tools:
Let’s now look at some tools that a data analyst might use.
- Microsoft Excel: Using formulae in a spreadsheet, Microsoft Excel is software that lets you arrange, format, and calculate data. Data analysts can use Microsoft Excel to conduct simple queries and make pivot tables, graphs, and charts. Visual Basic for Applications is a macro programming language included with Excel (VBA).
- Power BI: Power BI is a business analytics tool that lets you share insights throughout your organization and visualize your data. Power BI is primarily used for data visualization, similar to Tableau. However, while Power BI is a more all-purpose business intelligence application, Tableau is designed with data analysts in mind. Now you can compare Power BI and Tableau.
The list above includes some tools used by data analysts, but don’t assume they are the only ones available. Like other things, getting the hang of the tools is a part of the learning curve.
Applications of Data Analysis
The use of data analytics happens in various industries. Some examples are as follows:
- Transportation: Data analytics is used to enhance transportation systems and the surrounding intelligence. The research’s predictive methodology aids in identifying transportation issues, including network or traffic congestion. It assists in synchronizing the enormous amount of data and uses it to create and design plans and strategies to plan alternate routes, reduce traffic, and minimize accidents.
- Web: Web search engines like Yahoo, Bing, DuckDuckGo, and Google will return results when you search a data set. Every time you click the search button, search engines use data analytics algorithms to quickly give the most relevant results. Data analytics is used to obtain the data displayed whenever we perform an information search.
Among others. While these are some examples of applications, the benefits of data analysis are very helpful in the business world.
Benefits of Data Analytics
Some of the benefits are as follows:
- Customer Acquisition and Retention: Big Data applications are used by businesses to examine consumer trends and then modify their products and services in response to specific customer needs. This strategy significantly increases revenue and ensures customer satisfaction and loyalty. Couple it with data collaboration between various departments to get even better results.
- Focused and Targeted Promotions: Big Data is used by businesses to provide their target market with customized offerings. For example, companies can learn about customer patterns by tracking point-of-sale and internet purchases. Utilizing these insights, businesses may develop customer-focused, customized marketing that helps them meet client expectations.
- Potential Risks Identification: Big Data applications play a crucial role in creating efficient risk management strategies and procedures. Risks are reduced by using Big Data in Data Analytics and tools by optimizing complex results for unforeseen events and prospective threats.
Difference Between Data Analytics and Data Science
A group of disciplines used to mine massive datasets is collectively referred to as data science. Data analytics software provides a more specialized form, which can even be considered a component of the overall procedure. Analytics aims to produce quickly usable, actionable insights based on current inquiries.
Here is a table comparing data analytics and data science:
| Data Analytics | Data Science |
|---|---|
| Focuses on using pre-existing tools and techniques to analyze data | Focuses on developing new algorithms and methods for analyzing data |
| Uses statistical analysis and visualization to find trends and patterns in data | Uses a variety of techniques including machine learning, statistical analysis, and visualization to find trends and patterns in data |
| Goal is to find insights that can inform business decisions | Goal is to gain a deeper understanding of the data and draw insights from it |
| Works with structured data that is easy to analyze | Works with structured and unstructured data |
| Data analysts typically have a background in statistics or economics | Data scientists typically have a background in computer science or a related field |
It is worth noting that these are generalizations and there is overlap between the two fields. Some data analysts may work with machine learning algorithms, and some data scientists may work with structured data.
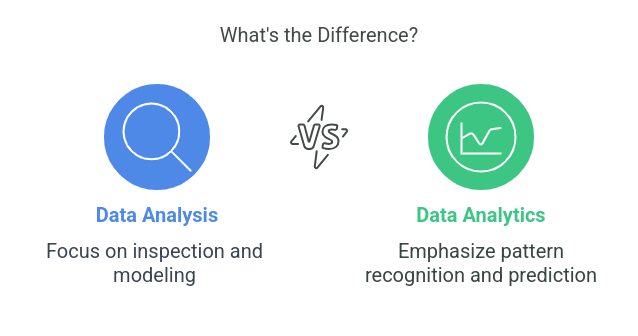
Also Read: Difference Between Data Analysis and Data Analytics
Difference Between Data Analytics and Big Data Analytics
Unstructured and raw data can be found in big data. Big data’s primary goal is to transform unstructured data into valuable data sets that may be used to derive insightful conclusions or address challenging business issues. Data analytics, however, primarily uses structured data.
Here is a table comparing data analytics and big data analytics:
| Data Analytics | Big Data Analytics |
|---|---|
| Involves analyzing small to medium-sized datasets | Involves analyzing very large datasets that may be too large to store on a single machine |
| Can be performed using traditional statistical analysis tools | Requires the use of specialized tools and frameworks, such as Hadoop and Spark, to handle the scale of the data |
| Focuses on finding insights and trends in the data | Focuses on processing and analyzing data in real time, often using streaming analytics |
| Can be used to answer specific questions or hypotheses | Can be used to discover new trends and patterns in the data that may not have been previously identified |
Again, these are generalizations, and there is an overlap between the two fields. Some data analytics projects may involve working with very large datasets, and big data analytics may involve using traditional statistical analysis techniques.
Data Analytics Case Study
One of the most interesting case studies is of Netflix. And the same is elaborated on in detail below:
Netflix collects data from its 163 million global subscribers, including what viewers watch and when, what devices they use, whether they pause and resume a show, how the platform rates certain content, and precisely what users search for when looking for new content to watch.
Then, using data analytics, Netflix can link all these different data points to create a comprehensive viewing profile for each user. Then, based on notable trends and patterns within each user’s viewing activity, the recommendation system offers personalized (and amazingly accurate) choices for what the user might want to watch next.
This personalized service significantly impacts the user experience; according to Netflix, personalized recommendations account for over 75% of viewing engagement. Looking at their income and usage numbers, you’ll notice that Netflix constantly dominates the global streaming market—and they’re increasing yearly. This effective use of data analytics also dramatically adds to the company’s success.
Here is a hypothetical example of a data analytics case study:
Company X is a retail business that wants to improve its sales. They have collected data on their sales over the past year, including information on the products that were sold, the location of the stores, and the demographics of the customers.
The data analytics team at Company X is asked to analyze this data to identify trends and patterns that can inform the company's sales strategy.
The team begins by visualizing the data using tools such as bar graphs and scatter plots. They find that store location is a significant factor in sales, with stores in certain areas performing much better than others. They also find that certain products are more popular among certain demographic groups.
Based on these findings, the team makes recommendations to the company on how to optimize their sales strategy. For example, they recommend opening new stores in high-performing areas and focusing their marketing efforts on the products that are most popular among their target demographic.
The company implements these recommendations and sees an increase in sales over the following months. The data analytics team continues to monitor sales data and make further recommendations as needed.
A Career in Data Analytics
Who is a Data Analyst
To find the solution to a problem or provide an answer to a question, a data analyst gathers, purifies, and analyses data sets. They work in various fields, such as government, business, finance, law enforcement, and science.
What Do Data Analysts Do?
Some of the typical tasks and responsibilities of a data analyst can be as follows:
- Utilize data visualization software to oversee the distribution of customer satisfaction surveys and report on the outcomes.
- Develop needs, provide success criteria, manage and carry out analytical projects, and assess outcomes in collaboration with business line owners.
- Keep an eye on procedures, systems, and practices to spot areas for improvement.
- To define concepts and assess needs and functional requirements, proactively interact with stakeholders, business units, technical teams, and support teams.
- Convert crucial inquiries into specific analytical tasks.
- Assemble fresh information to address client inquiries, compiling and organizing data from many sources.
- Using reports and interactive dashboards, use analytical techniques and tools to extract and deliver fresh insights to clients.
The above pointers are to give you a glimpse of the responsibilities of a data analyst, but they aren’t the same. The typical work process of a data analyst also includes the following steps:
- Define the questions
- Collect data
- Clean the data
- Analyze
- Visualize and share findings
Read in Detail: Data Analyst Job Description and How to Become One
Future of Data Analysis
In today’s market, data has emerged as one of the most plentiful—and valuable—commodities. Big data is a topic that is frequently discussed due to its significance. However, data is only valuable when refined, even though it is often referred to as the “new oil.” The value of a company’s data depends on its use, which is why the role of the data analyst is becoming increasingly crucial.
Here are a few trends and developments that are shaping the future of data analysis:
- Increasing volume and variety of data: The amount of data being generated is expected to continue to grow exponentially, and this data is becoming more diverse in terms of sources and formats. This presents both challenges and opportunities for data analysts.
- Machine learning and artificial intelligence: The use of machine learning and artificial intelligence in data analysis is expected to increase, with these technologies being used to automate and enhance many of the tasks currently performed by data analysts.
- Streaming analytics: The ability to analyze real-time data as it is being generated is becoming increasingly important. This requires the use of specialized tools and techniques, such as streaming analytics.
- Cloud computing: The use of cloud computing platforms for data analysis is expected to continue to grow, as these platforms offer scalable and cost-effective solutions for storing and processing large amounts of data.
- Data literacy: As the importance of data grows, there is an increasing need for individuals across all industries to have at least a basic understanding of data analysis. This is leading to a focus on data literacy, with the goal of empowering more people to understand and work with data.
Conclusion
The article gives a thorough overview of the exciting field of data analytics. We’ve covered many topics, from essential tools and methods to some of the most crucial abilities you’ll need to devise to work as a data analyst. It may seem intimidating if you’re brand-new to the profession with all these abilities and prerequisites (not to mention the technical jargon), but it’s crucial not to let that discourage you!