If you are still manually filtering rows, copying and pasting data, or writing VLOOKUPs that break every time someone inserts a column, your spreadsheet skills are a liability. True data analysis is about automation and scalability.
A quick reference guide is a good starting point, but real expertise is built from hands-on learning. The Master Data Analytics in Excel course from Great Learning teaches data cleaning, advanced formulas, PivotTables, and visualization through real-world projects. By the end, you’ll be able to turn raw data into clear, actionable insights.
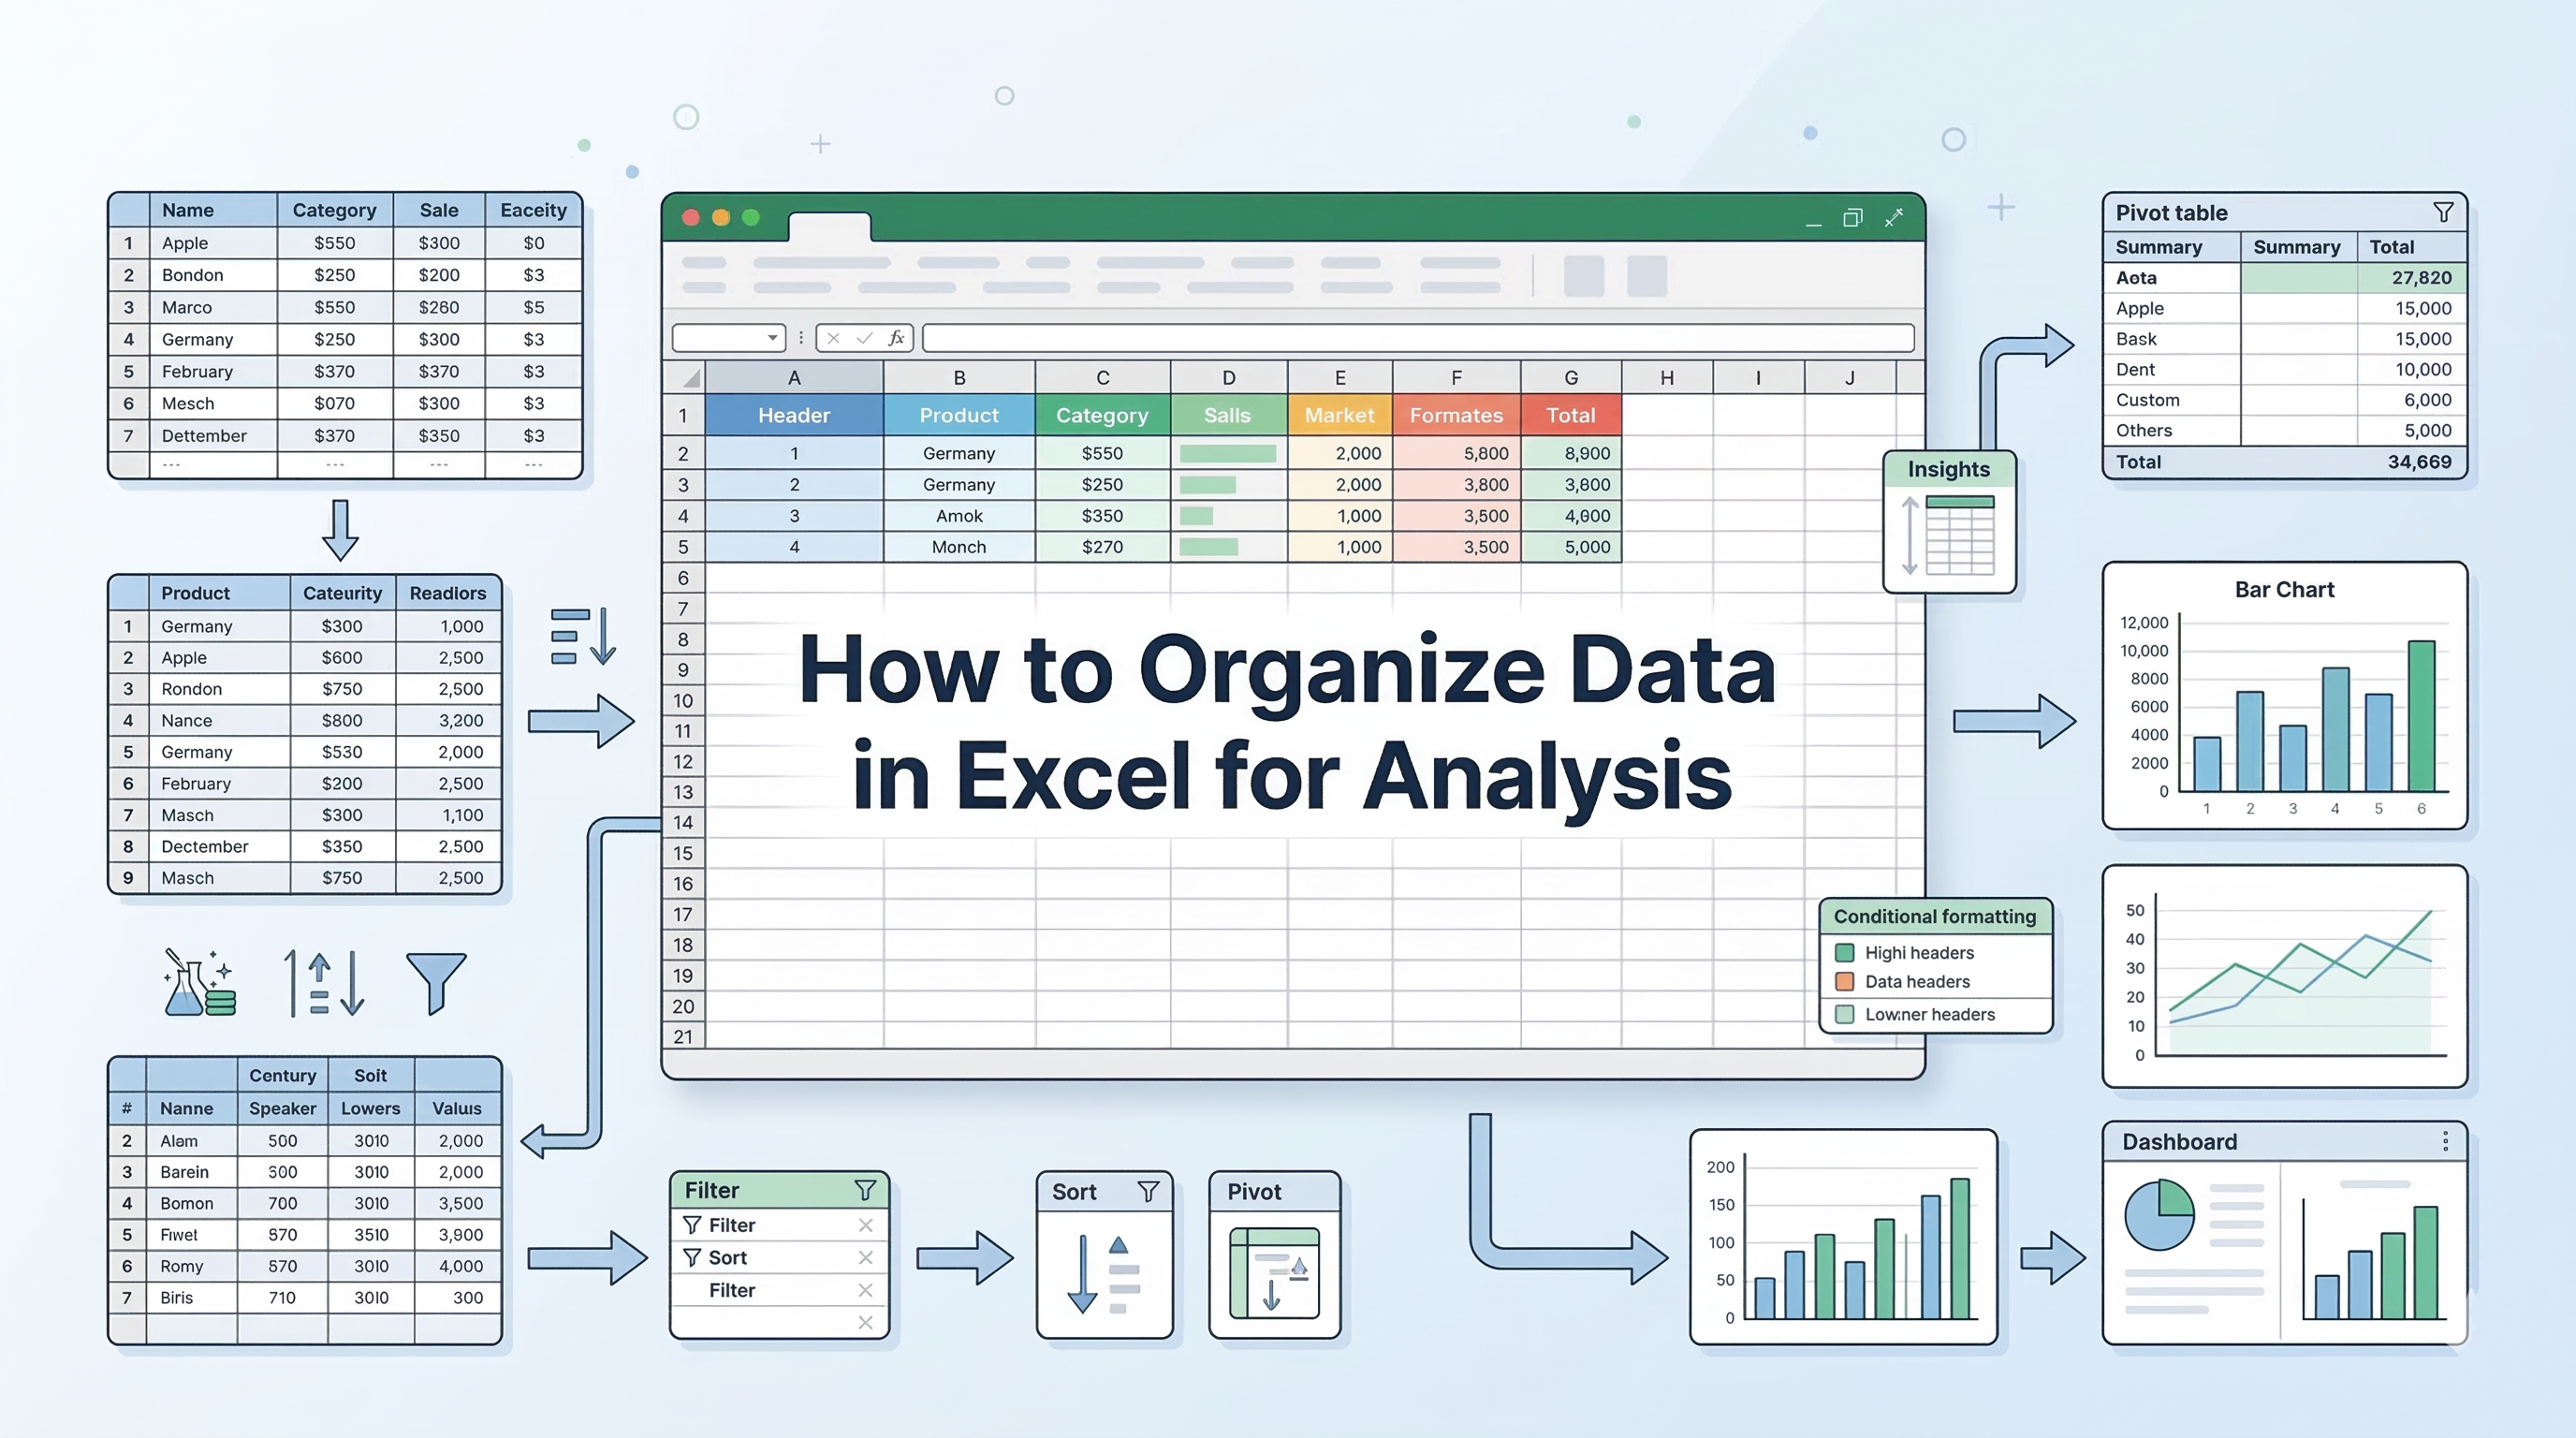
Learn Excel for powerful data analysis and enhance your skills for better decision-making.
However, if you are looking for a quick reference, below are seven essential Excel functions for data analysis that help transform raw data into actionable insights, explained with a sample dataset.
Sample Dataset
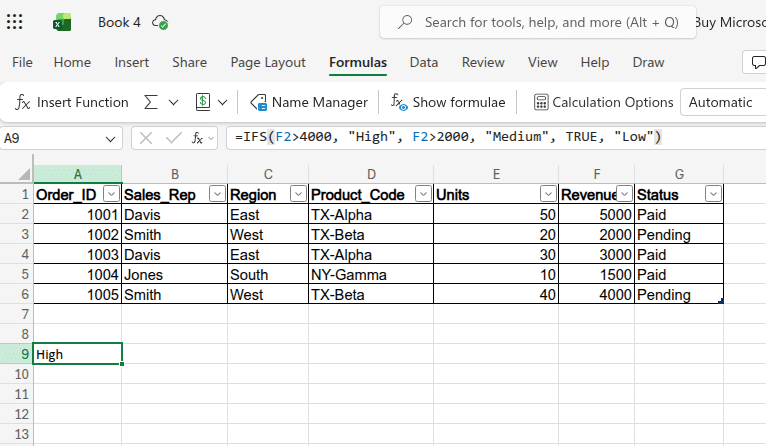
| Order_ID | Sales_Rep | Region | Product_Code | Units | Revenue | Status |
| 1001 | Davis | East | TX-Alpha | 50 | $5,000 | Paid |
| 1002 | Smith | West | TX-Beta | 20 | $2,000 | Pending |
| 1003 | Davis | East | TX-Alpha | 30 | $3,000 | Paid |
| 1004 | Jones | South | NY-Gamma | 10 | $1,500 | Paid |
| 1005 | Smith | West | TX-Beta | 40 | $4,000 | Pending |
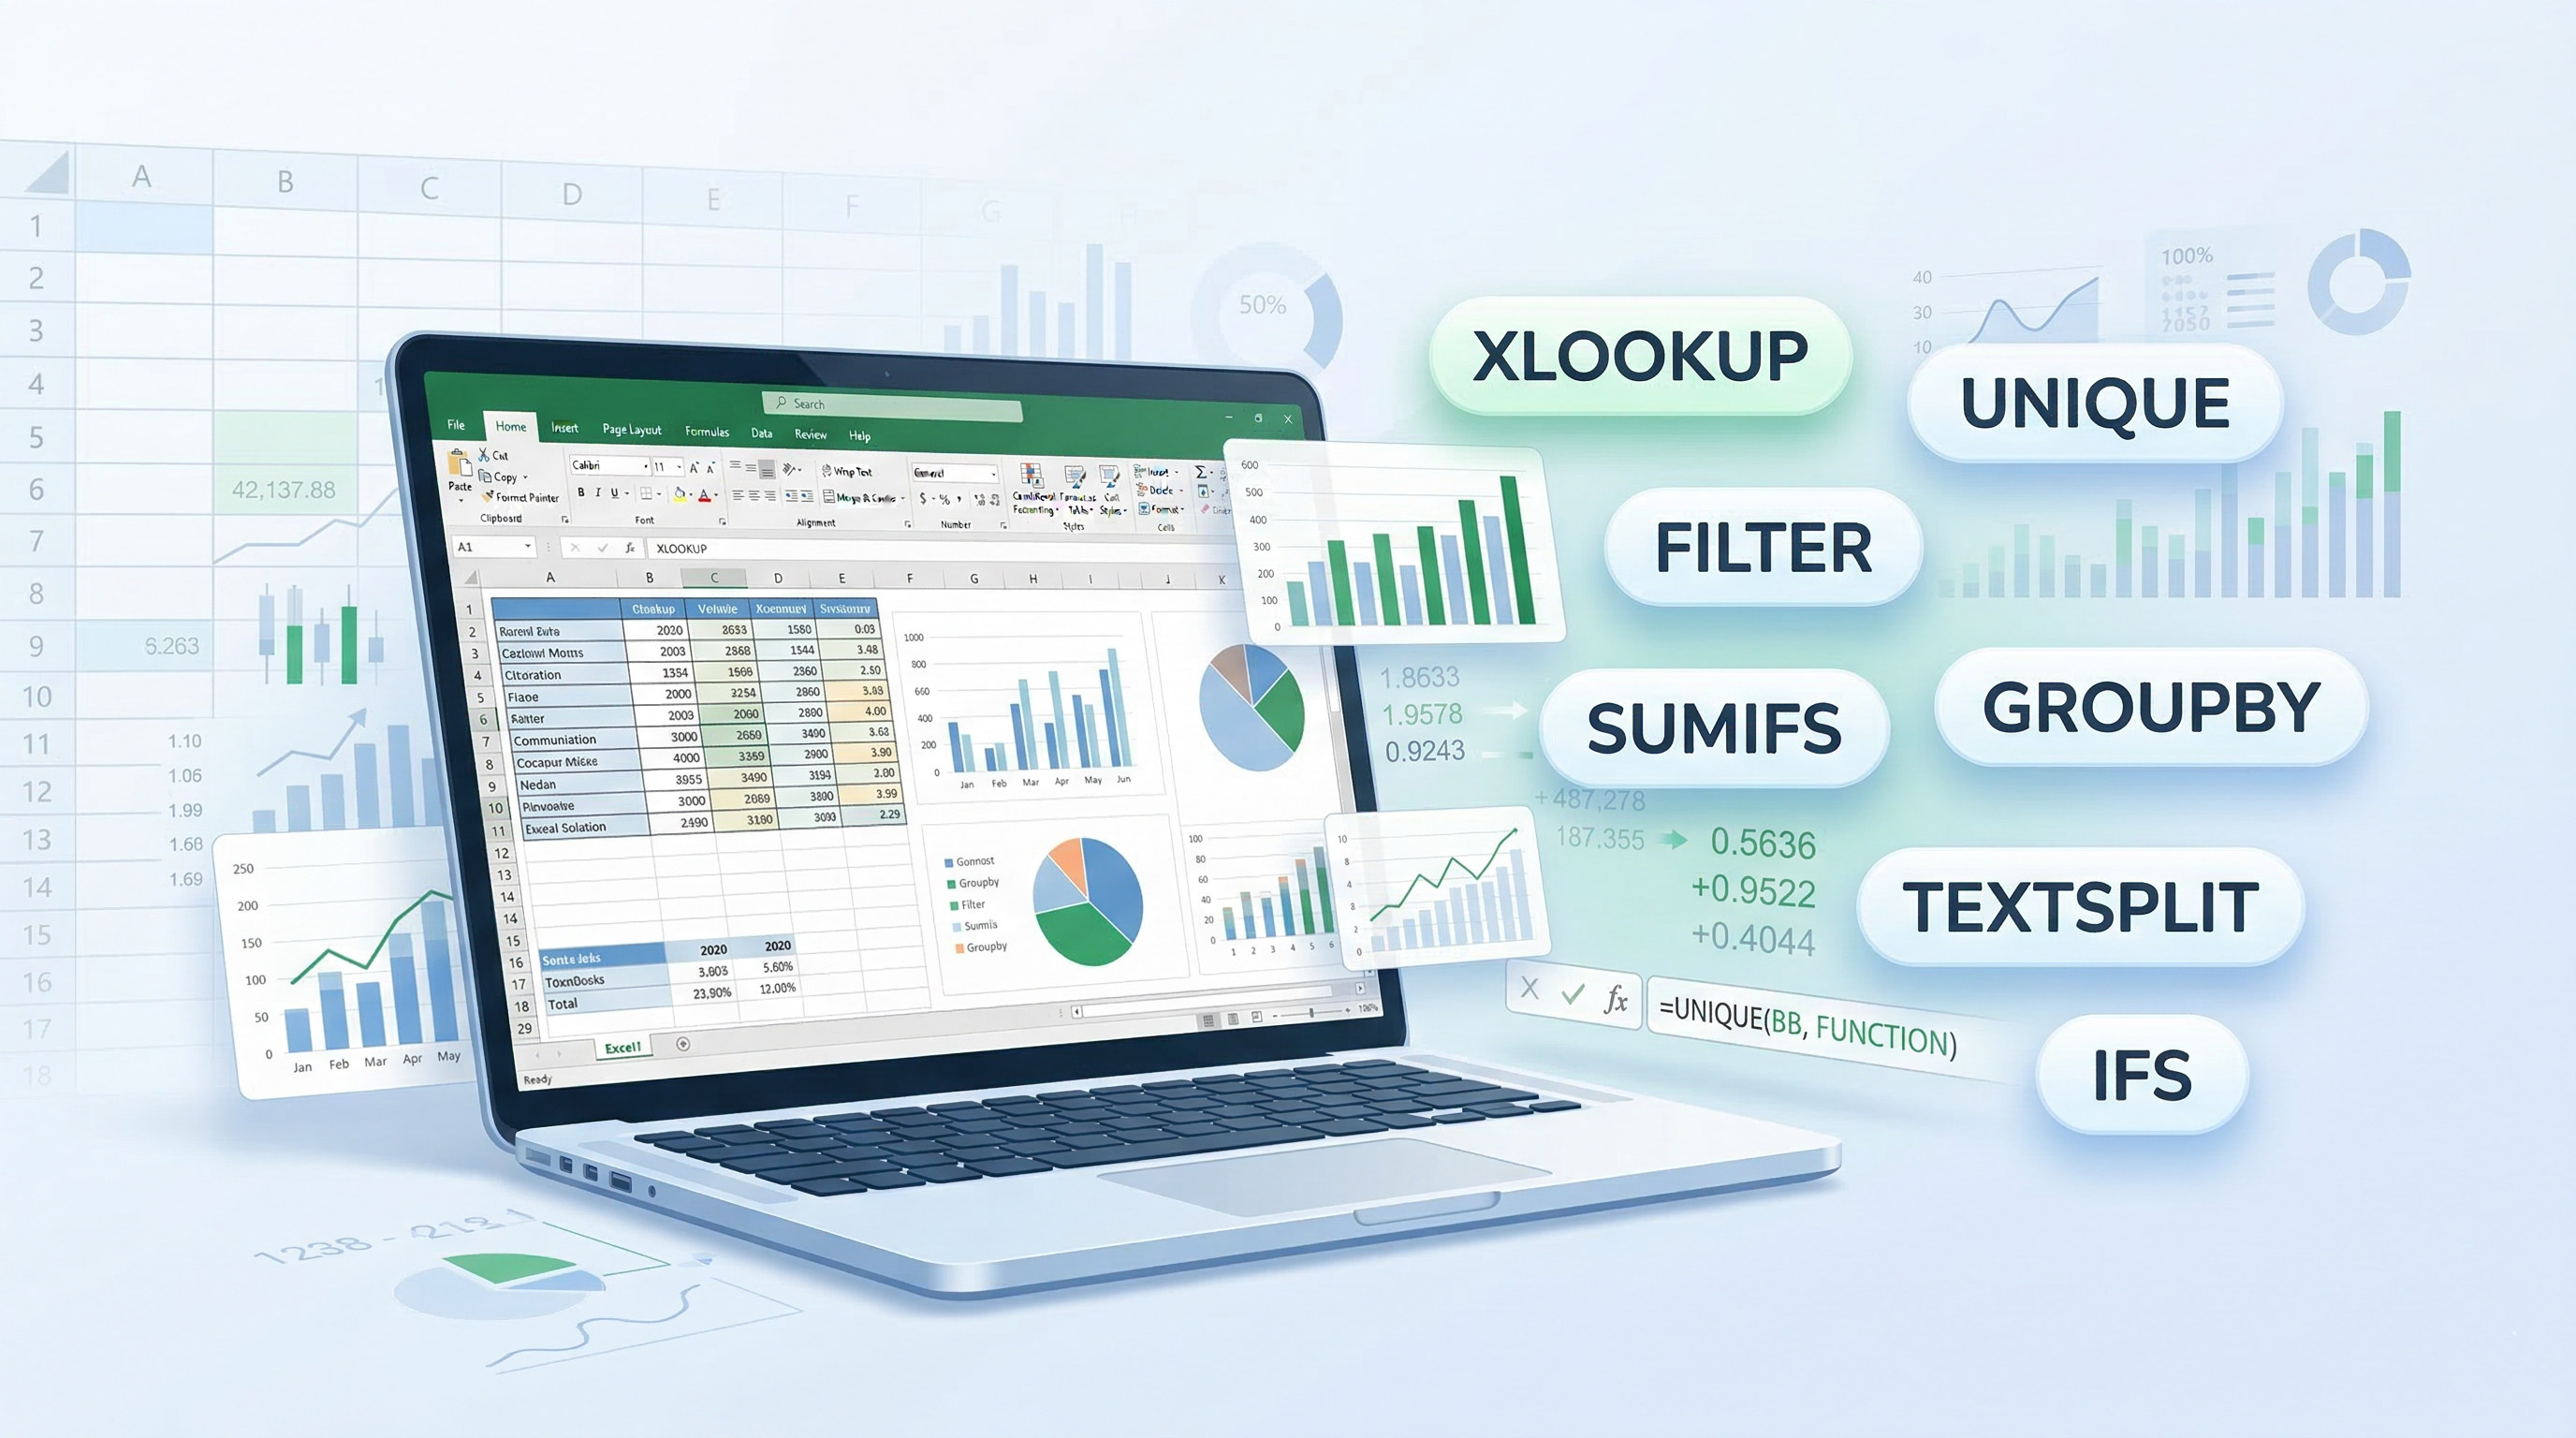
7 Important Excel Functions for Data Analysis
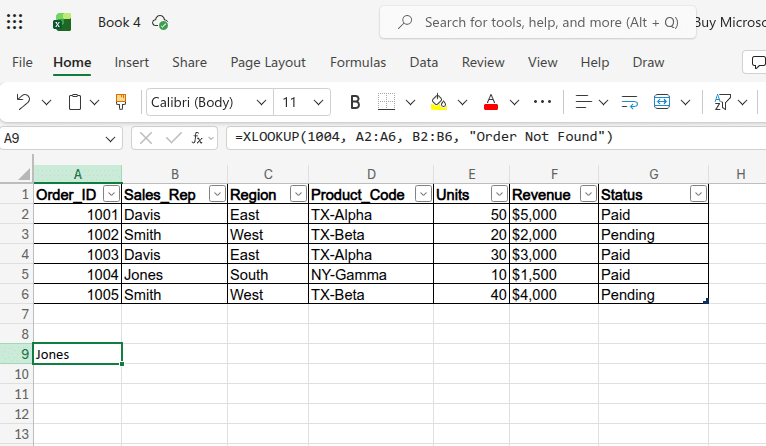
1. XLOOKUP: The Bulletproof Search
Compared to VLOOKUP, XLOOKUP is faster, works in any direction (left or right), and handles missing values gracefully without returning #N/A errors, making it far more reliable for real-world datasets. It also eliminates the need to count column indexes, reducing errors in large spreadsheets.
- For example: You need to find exactly who sold Order 1004 from a dataset containing order IDs and sales reps.
- The Formula: =XLOOKUP(1004, A2:A6, B2:B6, "Order Not Found")
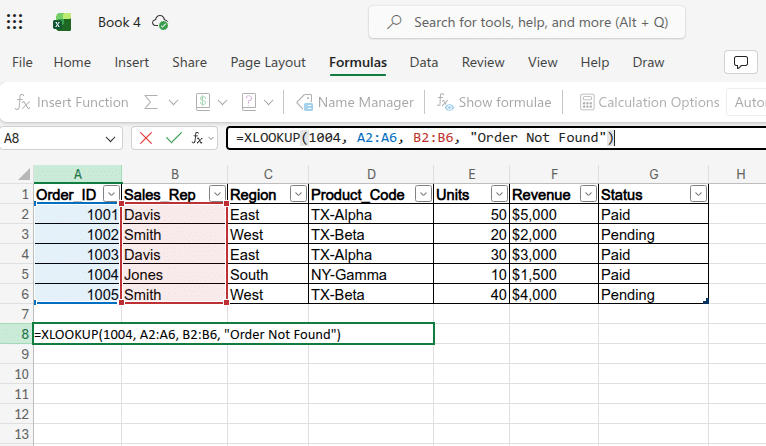
- The Output: Jones returned instantly, even if the lookup column is not the first column.
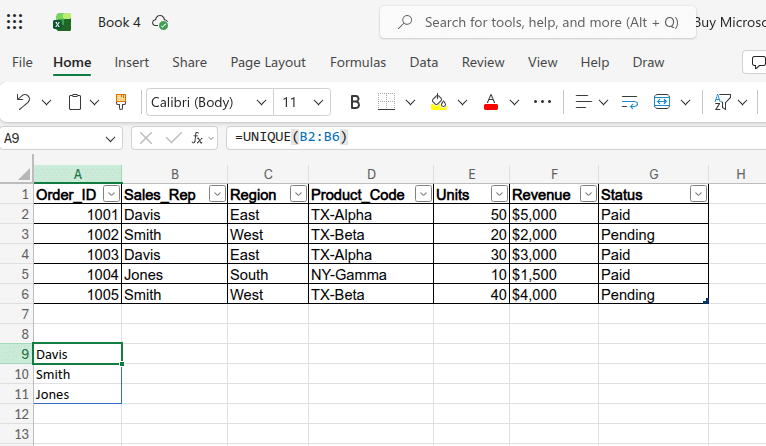
2. UNIQUE: Instant Deduplication
Instead of manually removing duplicates, UNIQUE dynamically extracts distinct values and updates automatically when new data is added, making it ideal for dashboards and dropdown lists. It ensures your data remains clean without repetitive manual effort.
- For example: You need a clean, auto-updating list of your active sales representatives for validation or reporting.
- The Formula: =UNIQUE(B2:B6)
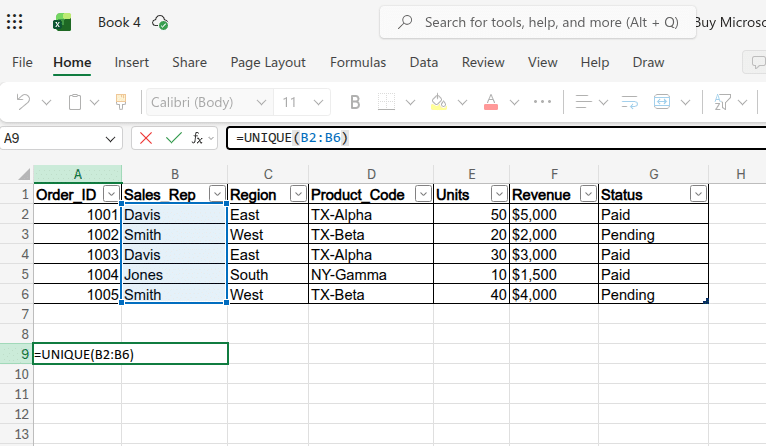
- The Output: A vertical list showing only Davis, Smith, and Jones, with duplicates removed automatically.
3. FILTER: Automated Data Segmentation
FILTER allows you to extract entire rows based on defined conditions, creating a live subset of your data that updates whenever the source changes. This is extremely useful for creating dynamic reports without copying or sorting data manually.
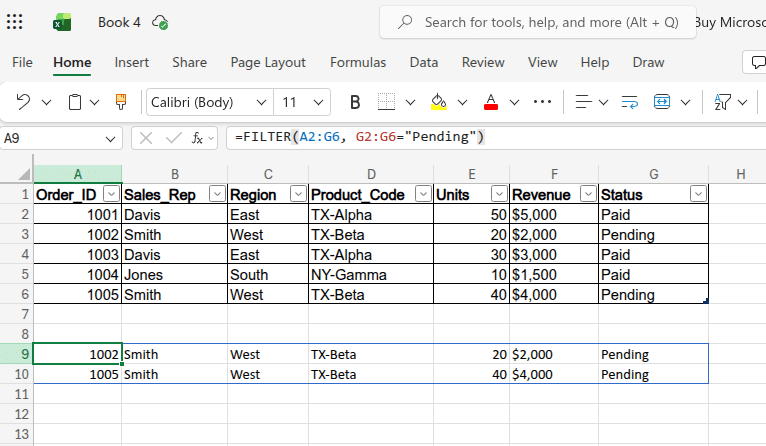
- For example: You need a separate table that shows only orders marked as “Pending” from a larger dataset.
- The Formula: =FILTER(A2:G6, G2:G6="Pending")
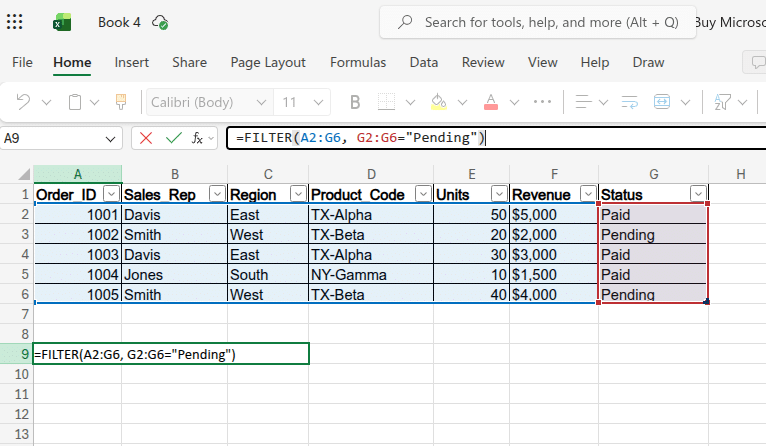
- The Output: A dynamic table displaying only rows 1002 and 1005, which updates instantly if order statuses change.
4. SUMIFS: Conditional Aggregation
Basic SUM functions are rarely sufficient for business analysis. SUMIFS enables you to calculate totals based on multiple criteria, allowing for deeper insights across dimensions like region, sales rep, or product category. It is scalable, meaning you can keep adding conditions as needed.
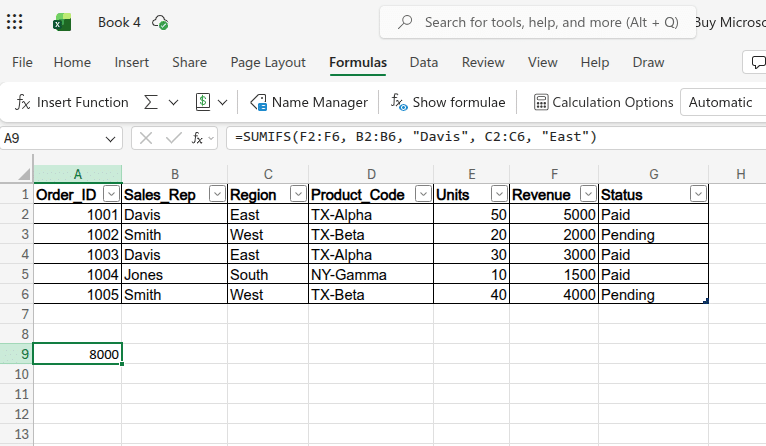
- For example, You want to calculate the total revenue generated specifically by Davis in the East region.
- The Formula: =SUMIFS(F2:F6, B2:B6, "Davis", C2:C6, "East")
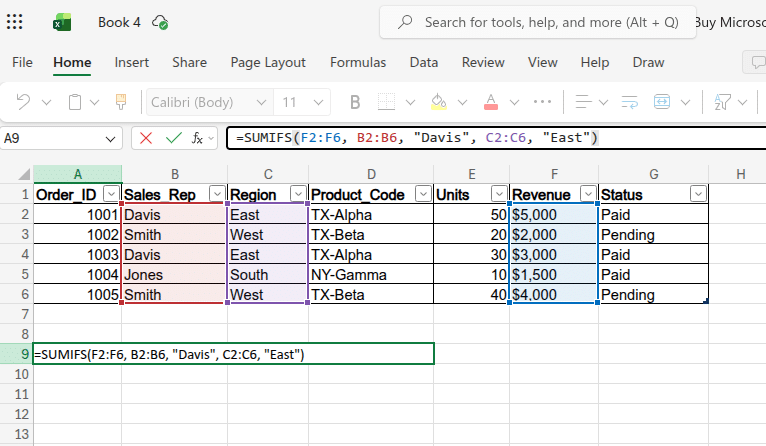
- The Output: $8,000, combining multiple matching transactions (orders 1001 and 1003).
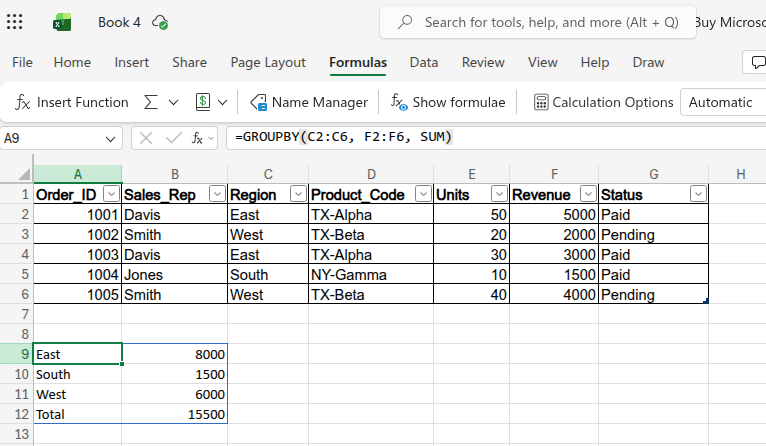
5. GROUPBY: Formula-Driven Pivot Tables
While Pivot Tables are powerful, they require manual refresh. GROUPBY creates a fully dynamic summary table using a formula, ensuring your analysis is always up to date without extra steps. It simplifies aggregation and grouping in modern Excel.
- For example: You need a continuously updated summary of total revenue grouped by each region.
- The Formula: =GROUPBY(C2:C6, F2:F6, SUM)
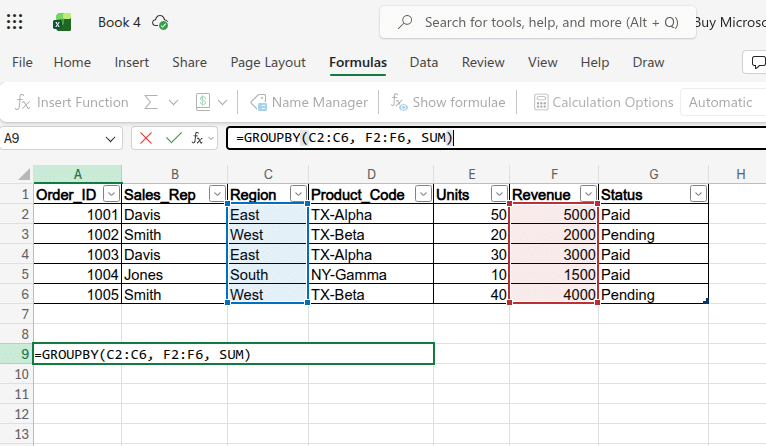
- The Output: A two-column summary showing East ($8,000), West ($6,000), and South ($1,500), updating automatically as data changes.
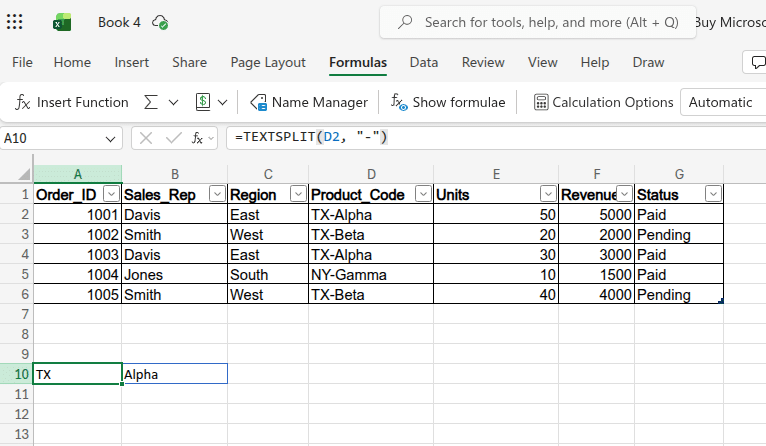
6. TEXTSPLIT: Modern Data Cleaning
TEXTSPLIT replaces complex combinations of LEFT, RIGHT, and FIND functions by allowing you to split text into multiple columns based on a delimiter. This is especially useful when working with messy or combined data fields.
- For example: Your Product_Code column contains combined values like “TX-Alpha,” and you need to separate the state and product name.
- The Formula: =TEXTSPLIT(D2, "-")
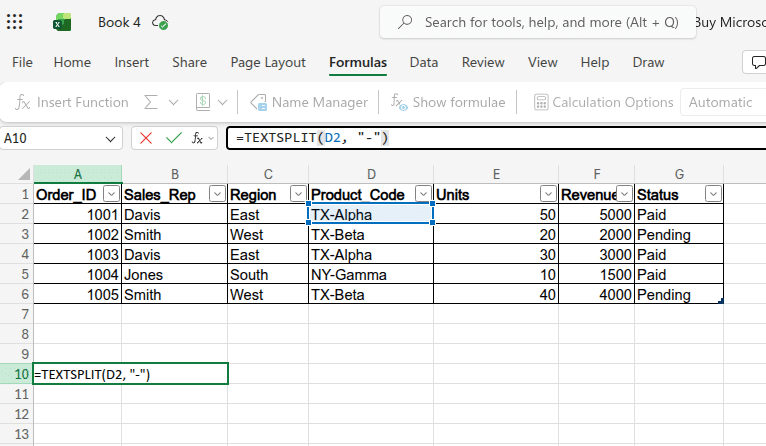
- The Output: Two separate cells: TX and Alpha, enabling cleaner data for analysis.
7. IFS: Clean Logical Tests
Nested IF statements quickly become unreadable and error-prone. IFS simplifies this by evaluating multiple conditions in sequence and returning the first true result, making your formulas cleaner and easier to maintain.
- For example: You want to assign commission tiers based on revenue thresholds, above $4,000 is “High,” above $2,000 is “Medium,” and the rest is “Low.”
- The Formula: =IFS(F2>4000, "High", F2>2000, "Medium", TRUE, "Low")
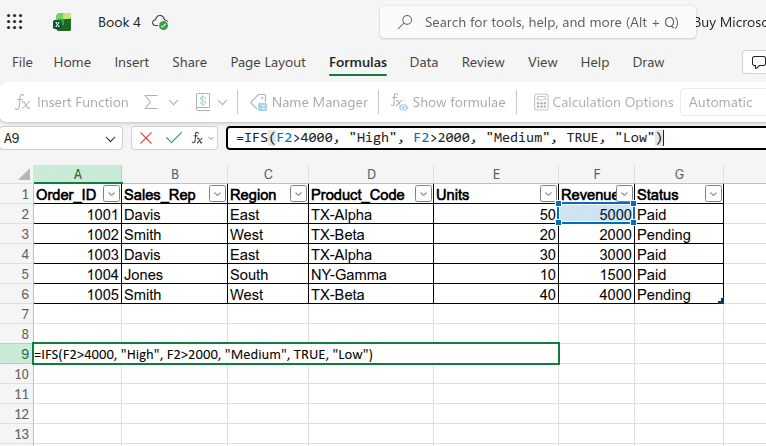
- The Output: For Order 1001 ($5,000), it returns High; for Order 1004 ($1,500), it returns Low, ensuring consistent classification across your dataset.
To build a clearer understanding of Excel formulas and functions, you can watch this beginner-friendly video on Excel fundamentals. It walks through the key concepts step by step and is a great place to start if you want to strengthen your basics.
Stop Guessing, Start Testing
Memorizing a list of Excel functions for data analysis won't make you an analyst. The real skill is knowing how to nest FILTER inside UNIQUE, or dynamically feeding a TEXTSPLIT result into an XLOOKUP.
If you feel comfortable with these basics, it’s worth testing your understanding in a practical setting with our Excel quiz. Working through messy, real-world datasets can help you spot gaps in your logic before they show up in an actual company spreadsheet.
Next Step
Understanding Excel functions for data analysis is only the starting point; gaining insight into the broader architecture behind them is equally important, as while an article can introduce useful tools, a structured curriculum enables you to build complete, scalable solutions.
If you are ready to move beyond basic data entry to developing robust reporting systems, a well-defined framework becomes essential, and Great Learning’s Master Data Analytics in Excel course serves as the next step by going beyond introductory concepts and focusing on applying advanced functions in practical, business-oriented scenarios.