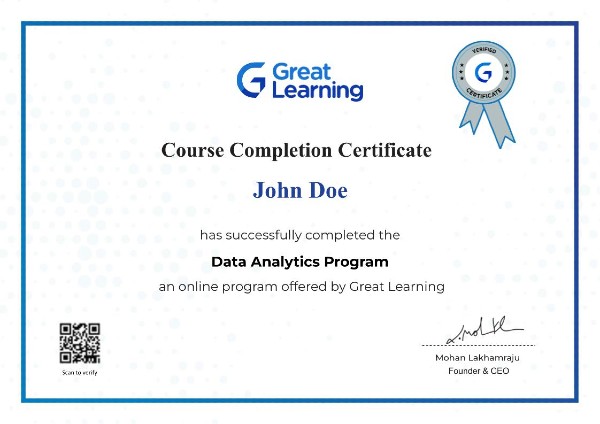
Get a certificate of completion from Great Learning
Showcase your mastery of data analytics skills

Trustpilot
4.8/5

Course Report
4.89/5

Comprehensive Curriculum
3
Months
3
Projects
Designed by top data professionals, the curriculum gives you the exposure you need to break into data analytics domain.
- Why Excel? What are the advantages of Excel?
- CSV File Format
- Tools, Ribbons, Commands
- Cell Referencing
- Tables
- Basic Arithmetic Functions (+,-,*,/)
- Date Functions
- Sorting
- Filtering
- IF ELSE
- Seeing Patterns in Data
- Sample and Population
- Central Tendency (Mean, Median, Mode)
- Dispersion (Range, Variance, Standard Deviation)
- Five Point Summary
- Setting up Google Colab
- Variables
- Data Types
- Data Structures
- Conditional Statements
- Loops
- Functions
- Introduction to Analytics Lifecycle
- Datasources and Databases
- A Typical Data Pipeline
- Insight Generation and Recommendation
- End-to-end Business Case Study Demo
- Pivot Tables
- Sorting Data in Pivot Tables
- Filtering Data in Pivot Tables
- Analyze Tab
- Exploring Charts
- Descriptive Statistics
- MySQL Installation
- Importing a Database
- Introduction to RDBMS
- Selecting Data
- Filtering Data
- Aggregating Data
- Joining Data
- Window Functions
- Order-of-Execution
- Sub-Queries
- NumPy Arrays
- NumPy Functions
- Indexing
- Accessing
- Pandas Series
- Pandas Dataframes
- Saving Loading
- Merging Dataframe
- Pandas Functions
- Histogram
- Box Plot
- Line Plot
- Scatter Plot
- Joint Plot
- Violin Plot
- Strip Plot
- Heatmap
- Plotly
- Customising Plots
- Data Sanity Checks
- Univariate Analysis
- Bivariate Analysis
- Missing Value Treatment
- Outlier Detection
- Tableau Public Installation
- Dimensions and Measures
- Data Types
- Choosing-charts with SHOW ME
- Calculations
- Dates and Date Functions
- Filtering
- Dashboarding-101
- Parameters
- Actions
- Sorting
- Special Charts
- What-if-Analysis
- Reshaping Data
- Level-of-Detail
Pre-Work Course (Week 0)
Introduction to Excel
Descriptive Statistics
Introduction to Python Programming
Foundations of Data Analytics (Week 1-2)
Overview of Industry 4.0 and World of Data
Generating Insights Using Excel
Data Analytics with SQL (Week 3-5)
Querying Data with SQL
Advanced Querying to Extract Business Insights
Project Week
Data-Driven Insights Using Python (Week 6-9)
Data Transformation Using NumPy and Pandas
Data Visualisation with Seaborn
Exploratory Data Analysis
Project Week
Creative Storytelling with Tableau (Week 10-12)
Storyboarding 101 with Tableau
Tableau for Building Interactive Dashboards
Project Week
Learn in demand tools


Fees and Application Details
Start learning by paying
USD 200*
Program Fee: USD 1200
Pay in Full
Discount % AvailableUSD 900
Key Learning Outcomes
- Learn to gather meaningful insights & optimize your business
- Explore, analyze, and find patterns in the data using Python
- Create engaging visual stories using tableau
- Aquire structured problem solving approach
Upcoming Application Deadline
Admissions are closed once the requisite number of participants enroll for the upcoming cohort. Apply early to secure your seat.
Deadline: 4th Feb 2026

Reach out to us
We hope you had a good experience with us. If you haven’t received a satisfactory response to your queries or have any other issue to address, please email us at
help@mygreatlearning.comBatch Start Dates
Online
To be announced


