Free Tableau Course
Tableau for Beginners
Learn the basics of Tableau in this free tableau course and get started with Data Analytics. You will learn about different Tableau tools/charts, and how to visualise maps, segmentations, dashboards and scatter plots using filters
Instructor:
Mr. R VivekanandAbout this course
The Tableau for Beginners course will help you get started with Tableau for Data Visualisation and Analysis. The first module will introduce you to What visualization analytics is and why it is important. In the next module, you will get a hands-on demo and learn important Tableau Tools and Charts. You will then learn about the visualization of maps and how to scatter plots using filters. The course then introduces you to segmentations, dashboards, numeric calculations, and the concept of strings and functions. In the final part, you will learn the Datediff function and how it works. You will also get a hands-on tutorial on different parameters in Tableau. Complete the quiz at the end of the course and get a certificate.
After completing this free, self-paced, beginner's course on Tableau, you can embark on your Data Science career with professional Data Science Courses from Great Learning.
Course outline
Get access to the complete curriculum once you enroll in the course
Level up with advanced skills & become job ready with Pro+
Subscribe to Pro+ today to build skills with 50+ Pro courses and prep for jobs with advanced AI tools.
Tableau Data Visualization Essentials

Practice exercises

Guided Projects

AI Resume Builder

AI mock interviews
What our learners enjoyed the most
Skill & tools
70% of learners found all the desired skills & tools
Our course instructor

Mr. R Vivekanand
Co-Founder and Director
Frequently Asked Questions
Will I receive a certificate upon completing this free course?
Is this course free?
Will I have lifetime access to this free Tableau for Beginners course?
Yes, once you enroll in the course, you will have lifetime access, where you can log in and learn whenever you want to.
What are the steps to enroll in this Tableau for Beginners course?
Enrolling in any of the Great Learning Academy’s courses is just one step process. Sign-up for the course, you are interested in learning through your E-mail ID and start learning them for free online.
Why choose Great Learning Academy for this free Tableau for Beginners course?
Great Learning Academy provides this Tableau for Beginners course for free online. The course is self-paced and helps you understand various topics that fall under the subject with solved problems and demonstrated examples. The course is carefully designed, keeping in mind to cater to both beginners and professionals, and is delivered by subject experts. Great Learning is a global ed-tech platform dedicated to developing competent professionals. Great Learning Academy is an initiative by Great Learning that offers in-demand free online courses to help people advance in their jobs. More than 5 million learners from 140 countries have benefited from Great Learning Academy's free online courses with certificates. It is a one-stop place for all of a learner's goals.
Can I sign up for multiple courses from Great Learning Academy at the same time?
Yes, you can enroll in as many courses as you want from Great Learning Academy. There is no limit to the number of courses you can enroll in at once, but since the courses offered by Great Learning Academy are free, we suggest you learn one by one to get the best out of the subject.
Is there any limit on how many times I can take this free course?
Once you enroll in the Tableau for Beginners course, you have lifetime access to it. So, you can log in anytime and learn it for free online.
How much does this Tableau Course for Beginners cost?
It is an entirely free course from Great Learning Academy. Anyone interested in learning the basics of Tableau Course for Beginners can get started with this course.
Will I get a certificate after completing this Tableau for Beginners free course?
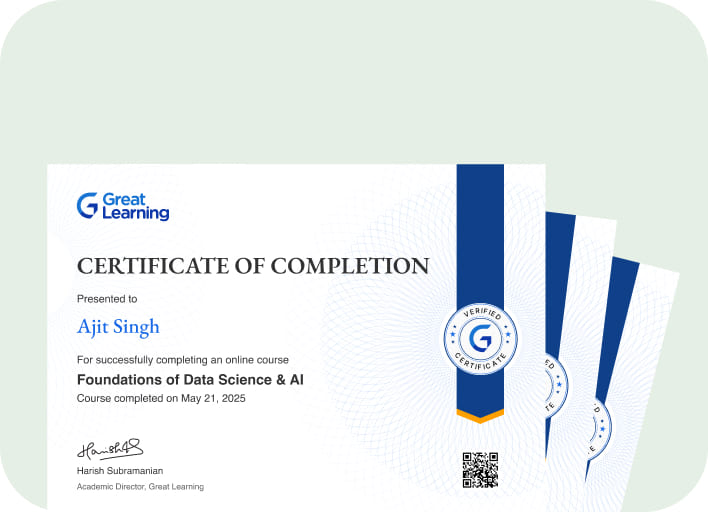
Yes, you will get a certificate of completion for the Tableau for Beginners after completing all the modules and cracking the assessment. The assessment tests your knowledge of the subject and badges your skills.
Is Tableau easy to learn?
Tableau is said to be one of the fastest evolving business intelligence and data visualization tools, which is very fast to deploy, easy to learn, and easy to use by a customer and also it does not require any coding, technical knowledge, or basics of using any tools. So, we can say that tableau is very easy to learn.
How do I start learning tableau?
Tableau is a data visualization tool, kt is very easy to learn, we should know how to learn and a better way to learn. So, when it comes to learning, here we have some tips. Firstly, see how tableau is applied in various scenarios, industries then follow the tableau community, read up tableau offline, identity and align skill sets and practice this is the way you can start learning (tableau free course).
Can I learn Tableau for free?
Tableau can be learned free of cost, there are many websites where we can learn tableau courses free of cost. It can be rather learned from the comfort of you i.e., by sitting at home, or else we can join live, interactive virtual training. Some of the websites which offer tableau courses free of cost are great learning, tutorials point, java t point, etc.
Is Tableau better than excel?
We cannot just say or come to the conclusion that tableau is better than excel or vice versa. Since Tableau is superior when it comes to dashboards and visuals, Excel is the spreadsheet tool that we need in order to perform various multi-layered calculations. Tableau is not optional when we like it to use for a data creating tool which excel cannot do.
Can you use python with tableau?
Yes, we can use python in tableau but we need to include some libraries, visuals. Since python is not a native scripting language for tableau. And also, to include python scripts we need to configure a connection between tableau and python servers.
Does Tableau involve coding?
The great thing about Tableau is that it does not require any technical knowledge or programming skills. This tool has taken interest among many people from all sectors. Tableau SDK is implemented using four languages, mainly C, C++, JAVA, and PYTHON. It allows us to code; hence, tableau does involve coding but not much, even people without any coding language can also survive.
What language does Tableau use for calculated fields?
Tableau does not include or use any programming languages for calculated fields. Since calculated fields in Tableau do not use any programming languages as such, it is similar to calculations in excel.
Is Tableau good for a career?
If the person wants his career to be in tableau, he or she should be good at team skills, problem-solving skills, managerial skills, and time management. Then his or her career will be perfect in tableau. Hence, we can say that tableau is good for a career.
Can I get a job with Tableau?
As of now, many professionals have understood very well, the values of business intelligence, data visualization. Since these are the future and also have bright career opportunities when it can be found in the tableau in upcoming years. Therefore, we would have a job in the field of Tableau.
What is required to learn Tableau?
To learn tableau we need not require any programming languages, coding, technical knowledge, or basics of using any tools. There is no prerequisite. We should be good at team skills, problem-solving, etc. Then we can easily learn tableau.
Is Tableau easy to learn?
Yes, Tableau is easy to learn, and it is designed in such a way that there are no extreme coding skills required. Even a non-technical learner can attain Tableau and learn its features quickly.
How do you use Tableau for beginners?
Beginners will be easily able to grasp the Tableau features and its mechanisms as it is designed more straightforwardly. You can get to know the start page of Tableau and how to connect to your data. Get familiar with the Tableau workspace and examine your data, use additional tools and gain valuable insights from your data.
Is Tableau free to learn?
You will find many articles, tutorials, and blog posts regarding Tableau for free on the web. You can also go for Great Learning’s free Tableau for beginners course and attain free certification in Tableau. Enroll in this comprehensive Tableau course if you are at a beginner level and get hold of all the skills required for understanding the Tableau tool.
Is Tableau hard to master?
Tableau is one of the rapidly growing and evolving data visualization and BI (Business Intelligence) tools. It is known for its fastest deployment and easy-to-learn features. Tableau uses an easy ‘drag and drop interface,’ making it easier to learn even for a non-programmer. Hence, almost 80% of Tableau is easy to learn and understand.
 4.62
4.62









.jpg)





 (1).png)




.png)
 (1).jpg)

.png)

.png)
.png)
.png)
.png)
.png)
.png)
.png)


.png)
.png)
.png)




.png)



.png)
.png)
.png)


.jpg)
.png)
.png)

.png)
.jpg)

.jpg)
.jpg)
.jpeg)
.jpg)
.jpg)
.png)
