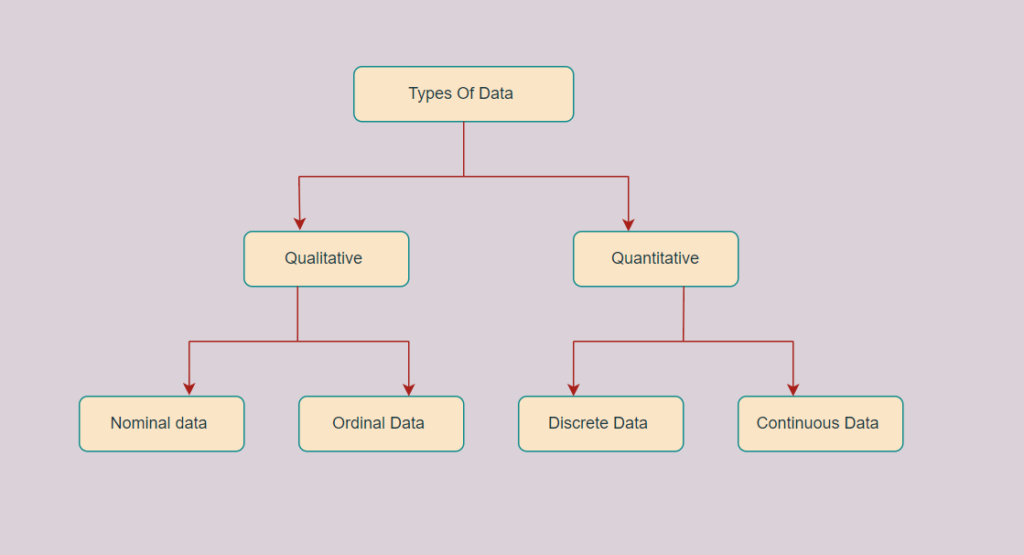
There are multiple types of data used in statistics, data science, and machine learning, each requiring different analysis methods. While working on this data, there are two types of data: "Qualitative" and "Quantitative" data, which are further classified into four primary types:
- Nominal
- Ordinal
- Discrete
- Continuous
Advanced classification also includes Interval and Ratio data, which determine what statistical operations are valid on your dataset.
This data is so important for us that it becomes important to handle and store it properly, without any errors. For example, a Data Warehousing Consulting firm is responsible for designing, implementing, and maintaining systems that ensure data is securely stored. So understanding these types of data becomes essential.
With a staggering 2.5 quintillion bytes of data generated daily, businesses rely heavily on data analytics for crucial insights. This data fuels campaign creation, strategy designing, product launches, and experimentation for better results.
Learn the fundamentals of data analytics and start making smarter, data-driven decisions.
What are the different types of data?
The two main types of data are:
- Qualitative Data
- Quantitative Data
Quick Reference: Types of Data in Statistics
| Attribute | Nominal | Ordinal | Interval | Ratio | Discrete | Continuous |
|---|---|---|---|---|---|---|
| Has Order? | ✗ | ✓ | ✓ | ✓ | ✓ | ✓ |
| Arithmetic Ops? | ✗ | ✗ | + / − | All | All (integers) | All |
| True Zero? | N/A | N/A | ✗ | ✓ | ✓ | ✓ |
| Best Chart | Pie, bar | Bar, stacked | Line, histogram | Scatter, ratio | Bar, frequency | Histogram, line |
| Statistical Test | Chi-square | Mann-Whitney | t-test, ANOVA | t-test, regression | Poisson, Binomial | ANOVA, regression |
Now, let's understand this in detailFavorite holiday destination
1. Qualitative or Categorical Data
Qualitative or Categorical Data is a type of data that can’t be measured or counted in the form of numbers.
These types of data are sorted by category, not by number. That’s why it is also known as Categorical Data. These data consist of audio, images, symbols, or text. The gender of a person, i.e., male, female, or others, is qualitative data.
Qualitative data tells about the perception of people. This data helps market researchers understand the customers’ tastes and then design their ideas and strategies accordingly.
The other examples of qualitative data are :
- What language do you speak
- Opinion on something (agree, disagree, or neutral)
The Qualitative data are further classified into two parts :
A. Nominal Data
Nominal Data is used to label variables without any order or quantitative value. The color of hair can be considered nominal data, as one color can’t be compared with another color.
The name “nominal” comes from the Latin name “nomen,” which means “name.” With the help of nominal data, we can’t do any numerical tasks or can’t give any order to sort the data.
Use Case in Data Science
In machine learning, nominal data is encoded using one-hot encoding (e.g., converting product categories like [Electronics, Clothing, Food] into binary columns) before feeding it into models like Decision Trees or Logistic Regression. Always remember that for nominal data, only the mode is used.
Examples of Nominal Data :
- Color of hair (Blonde, red, Brown, Black, etc.)
- Marital status (Single, Widowed, Married)
- Nationality (Indian, German, American)
- Gender (Male, Female, Others)
- Eye Color (Black, Brown, etc.)
B. Ordinal Data
Ordinal data have natural ordering where a number is present in some kind of order by their position on the scale. These data are used for observation like customer satisfaction, happiness, etc., but we can’t do any arithmetical tasks on them.
Ordinal data is qualitative data for which their values have some kind of relative position. These kinds of data can be considered “in-between” qualitative and quantitative data.
The ordinal data only shows the sequences and cannot use for statistical analysis. Compared to nominal data, ordinal data have some kind of order that is not present in nominal data.
Use Case in Data Science
In Natural Language Processing (NLP), sentiment analysis models often produce ordinal output, Positive > Neutral > Negative. This ordinal nature means you can rank results, but can't assume the gap between Positive and Neutral is equal to the gap between Neutral and Negative. For ordinal data, both mode and median are valid, but not the mean.
Examples of Ordinal Data :
- When companies ask for feedback, experience, or satisfaction on a scale of 1 to 10
- Letter grades in the exam (A, B, C, D, etc.)
- Ranking of people in a competition (First, Second, Third, etc.)
- Economic Status (High, Medium, and Low)
- Education Level (Higher, Secondary, Primary)
Must Read: 'What is Data Science? – The Complete Guide' to transform data into valuable insights by understanding the types of data in data science
Difference between Nominal and Ordinal Data
| Nominal Data | Ordinal Data |
| Nominal data can’t be quantified, neither they have any intrinsic ordering | Ordinal data gives some kind of sequential order by their position on the scale |
| Nominal data is qualitative data or categorical data | Ordinal data is said to be “in-between” qualitative data and quantitative data |
| They don’t provide any quantitative value, neither can we perform any arithmetical operation | They provide sequence and can assign numbers to ordinal data but cannot perform the arithmetical operation |
| Nominal data cannot be used to compare with one another | Ordinal data can help to compare one item with another by ranking or ordering |
| Examples: Eye color, housing style, gender, hair color, religion, marital status, ethnicity, etc | Examples: Economic status, customer satisfaction, education level, letter grades, etc |
Also read "What is Data Analytics" to grasp the fundamentals of extracting value from data.
C. Interval Data
Numerical scale with equal intervals between values but no true zero. You can add/subtract but not multiply/divide meaningfully.
• Examples: Temperature in Celsius/Fahrenheit, IQ scores, calendar years, Likert scale ratings (treated as interval in research)
• Cannot say "80°C is twice as hot as 40°C" (no true zero)
• Statistical tests: t-tests, ANOVA, Pearson correlation
2. Quantitative Data
Quantitative data is a type of data that can be expressed in numerical values, making it countable and including statistical data analysis. These kinds of data are also known as Numerical data.
It answers questions like “how much,” “how many,” and “how often.” For example, the price of a phone, the computer’s RAM, the height or weight of a person, etc., fall under quantitative data.
Quantitative data can be used for statistical manipulation. These data can be represented on a wide variety of graphs and charts, such as bar graphs, histograms, scatter plots, boxplots, pie charts, line graphs, etc.
Examples of Quantitative Data :
- Height or weight of a person or object
- Room Temperature
- Scores and Marks (Ex, 59, 80, 60, etc.)
- Time
The Quantitative data are further classified into two parts :
A. Discrete Data
The term discrete means distinct or separate. The discrete data contain the values that fall under integers or whole numbers. The total number of students in a class is an example of discrete data. These data can’t be broken into decimal or fraction values.
The discrete data are countable and have finite values; their subdivision is not possible. These data are represented mainly by a bar graph, number line, or frequency table.
Examples of Discrete Data :
- The number of customers who visited a store today is discrete (you can't have 5.7 customers), while the time each customer spent is continuous (4 minutes 32.6 seconds is valid).
- The total number of students present in a class
- Cost of a cell phone
- Number of employees in a company
- The total number of players who participated in a competition
B. Continuous Data
Continuous data are in the form of fractional numbers. It can be the version of an android phone, the height of a person, the length of an object, etc. Continuous data represents information that can be divided into smaller levels. The continuous variable can take any value within a range.
The key difference between discrete and continuous data is that discrete data contains the integer or whole number. Still, continuous data stores the fractional numbers to record different types of data such as temperature, height, width, time, speed, etc.
Examples of Continuous Data :
- Height of a person
- Speed of a vehicle
- “Time taken” to finish the work
- Market share price
Discover the must-reads for data enthusiasts: "Top 25 Data Science Books"
C. Ratio Data
Like interval data but with a true zero, enabling ratios.
• Examples: Height (cm), weight (kg), income (₹), age, time duration, number of sales
• Can say "₹80,000 salary is twice ₹40,000"
• Statistical tests: All parametric tests; coefficient of variation
Difference between Discrete and Continuous Data
| Discrete Data | Continuous Data |
|---|---|
| Discrete data are countable and finite; they are whole numbers or integers | Continuous data are measurable; they are in the form of fractions or decimal |
| Discrete data are represented mainly by bar graphs | Continuous data are represented in the form of a histogram |
| The values cannot be divided into subdivisions into smaller pieces | The values can be divided into subdivisions into smaller pieces |
| Discrete data have spaces between the values | Continuous data are in the form of a continuous sequence |
| Examples: Number of defective units in a batch (manufacturing), number of support tickets per day (SaaS), number of goals in a football match etc. | Example: Blood pressure reading, stock price at a point in time, CPU temperature in a server. |
Discrete data is typically visualized with a bar chart (gaps between bars show the data is countable). Continuous data uses a histogram (no gaps, showing a continuous range). This difference matters when choosing chart types in tools like Tableau, Power BI, or Python's Matplotlib
Don't just follow trends, understand them! Check out our blog post on the Latest Data Science Trends.
Types of Data by Structure: Structured, Unstructured, and Semi-Structured
• Structured Data: Organized in rows/columns (SQL tables, Excel sheets). Easiest for ML and analysis. 20% of enterprise data.
• Unstructured Data: No predefined format, text, images, audio, or video. Accounts for 80% of enterprise data (IBM, 2023). Requires NLP, CV, or deep learning to process.
• Semi-structured Data: Has tags or markers but no strict schema, JSON, XML, emails, or NoSQL databases.
For a more detailed understanding, check out- Structured and Unstructured Data: Definitions and Differences
Conclusion
We've explored what are the different types of data and their importance in analysis and decision-making. Understanding these data types is key to using them effectively for research, statistical analysis, data visualization, and extracting meaningful insights.
If you're interested in learning these concepts in more detail and want to pursue a career in data science, check out Great Learning's Free Data Science Foundations Course.
It's designed to provide you with essential skills and knowledge to kickstart your journey in this field. Additionally, our Data Science Course offers advanced training for those looking to dive deeper into the world of data science.
Visit our website to find the right course for you and take the first step towards a rewarding career in data science. Explore free courses with certificate to gain valuable skills, enhance your resume, and kickstart your journey in the ever-growing field of data science.
FAQs
Yes, in certain scenarios, ordinal data can be transformed into nominal data for specific analyses. For instance, if analyzing customer satisfaction levels on a scale of "very dissatisfied" to "very satisfied," these ordinal rankings can be converted into nominal categories such as "low," "medium," and "high" satisfaction.
Yes, data types play a significant role in selecting the appropriate machine learning algorithm. For instance, decision trees are well-suited for handling both nominal and ordinal data, while algorithms like linear regression are more suitable for continuous data.
In qualitative studies, ordinal data may be interpreted based on the relative order or ranking of categories, providing insights into preferences or perceptions. In quantitative studies, ordinal data may be treated as numerical values for statistical analysis, enabling comparisons and correlations.
Absolutely! Data preprocessing techniques such as encoding, scaling, or imputation can vary based on the data type. For instance, nominal data may require one-hot encoding, while continuous data might benefit from normalization or standardization.
Handling missing data differs for nominal and continuous variables. While nominal data may involve simple techniques like mode imputation (replacing missing values with the most frequent category), continuous data may require advance methods such as mean or median imputation or predictive modelling approaches