
- Why AgentOps Observability Matters for Production AI Agents
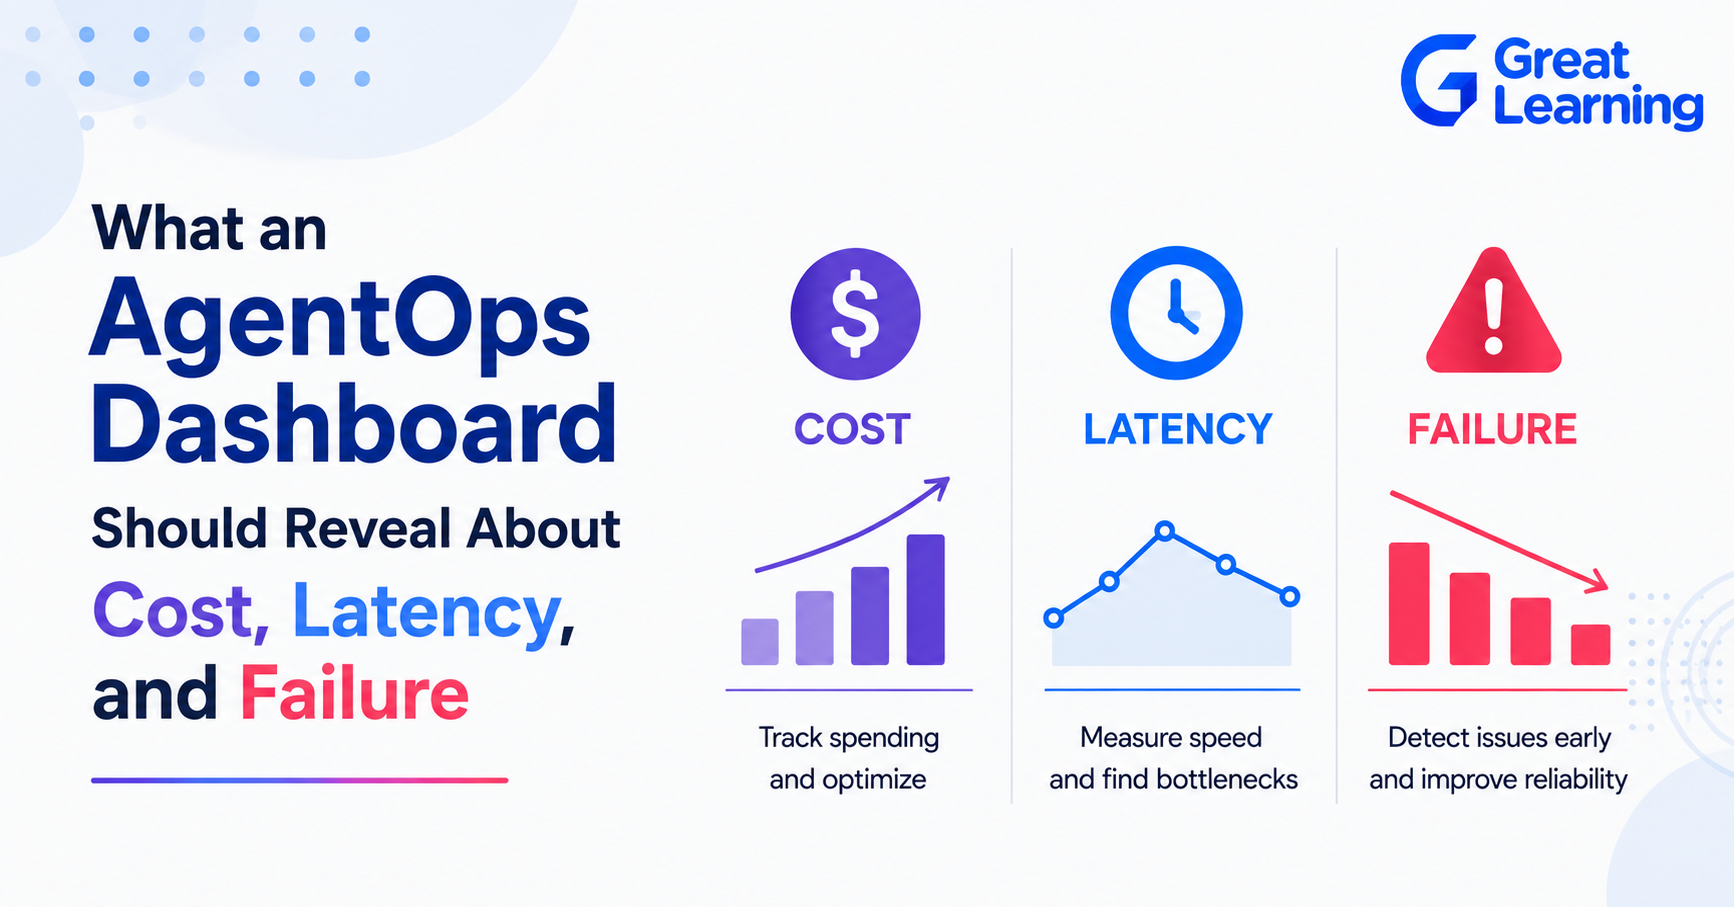
- What an AgentOps Dashboard Should Reveal About AI Agent Cost
- What an AgentOps Dashboard Should Reveal About Agent Latency
- What an AgentOps Dashboard Should Reveal About Agent Failures
- How Cost, Latency, and Failure Metrics Work Together
- How to Build an AgentOps Dashboard for Production AI Agents
- How to Use AgentOps Dashboards for Continuous Improvement
- How the Johns Hopkins University Agentic AI Program Builds AgentOps Skills
- How AgentOps Dashboards Support Production AI Agent Management
- Final Thoughts
- Frequently Asked Questions
AI agents can perform multi-step tasks by combining language models, tools, retrieval systems, APIs, and other components.
As these systems move into production, simply knowing whether an agent completed a request is not enough. Teams need visibility into how the agent executed the task, how much it cost, how long it took, and where it failed.
An AgentOps dashboard provides this operational view by bringing execution data into one place. Modern observability platforms can expose session-level costs, token usage, errors, execution time, tool calls, and detailed traces of individual agent runs.
For production teams, the key signals are cost, latency, and failure. LangChain's 2026 survey found that 57% of respondents have agents in production, while 89% have implemented agent observability, highlighting the growing need for production visibility.
This article explores what an AgentOps dashboard should reveal about these three dimensions, how teams can interpret the metrics, and how they can use them to improve the reliability and efficiency of AI agents.
Why AgentOps Observability Matters for Production AI Agents
Traditional application monitoring can show whether a service is available, but AI agents require deeper visibility into how each task is executed. An agent may complete a request successfully while making unnecessary model calls, taking an inefficient path, or using tools incorrectly.
An AgentOps dashboard should therefore provide run-level and step-level visibility. Teams need to see model calls, tool calls, errors, execution time, and the sequence of events that occurred during an agent run. Session waterfalls and traces can help identify where time was spent and which step caused an issue.
This visibility becomes particularly important when an agent uses multiple models, APIs, retrieval systems, or external tools. A single high-level success rate cannot explain why some runs are slower, more expensive, or less reliable than others.
A useful dashboard should help teams answer three basic questions:
- What did the agent do?
- How efficiently did it execute the task?
- Where did the execution fail or become unreliable?
These answers provide the foundation for monitoring cost, latency, and failure in production.
What an AgentOps Dashboard Should Reveal About AI Agent Cost
Cost monitoring should show more than the total amount spent across all agent runs. A useful dashboard should help teams understand where the cost comes from, which workflows are expensive, and whether spending is increasing over time.
At the run level, teams should be able to track total cost, token usage, and the models involved. At the step level, the dashboard should show which LLM calls, tools, or workflows contributed most to the final cost.
AgentOps dashboards, for example, provide cost and token information alongside session and event-level data.
Important cost metrics can include:
- Cost per agent run
- Input and output token usage
- Cost by model
- Cost by workflow or task type
- Cost by tool or execution step
- Average and peak cost
- Cost trends over time
These metrics can reveal inefficient prompts, excessive model calls, and costly agent loops. KPMG's 2026 Global AI Pulse found that only 26% of organizations have real-time visibility into AI costs, making granular cost monitoring increasingly important.
The goal is not simply to reduce cost. Teams should determine whether additional spending produces better accuracy, reliability, or task completion. A cheaper agent that frequently fails may ultimately be more expensive than a slightly costlier system that completes tasks reliably.
What an AgentOps Dashboard Should Reveal About Agent Latency
Latency monitoring should show how long an agent takes to complete a task and where that time is being spent.
End-to-end execution time alone is not enough because an agent may involve several model calls, retrieval steps, API requests, and tool interactions.
A useful dashboard should track:
- Total execution time
- Average and p95/p99 latency
- Latency by model call
- Tool and API latency
- Retrieval latency
- Time spent at individual workflow steps
- Latency trends across agent runs
A trace or waterfall view can make these metrics easier to interpret by showing the sequence and duration of individual events. AgentOps, for example, provides session-level execution time and waterfall views for LLM calls, actions, tools, and errors.
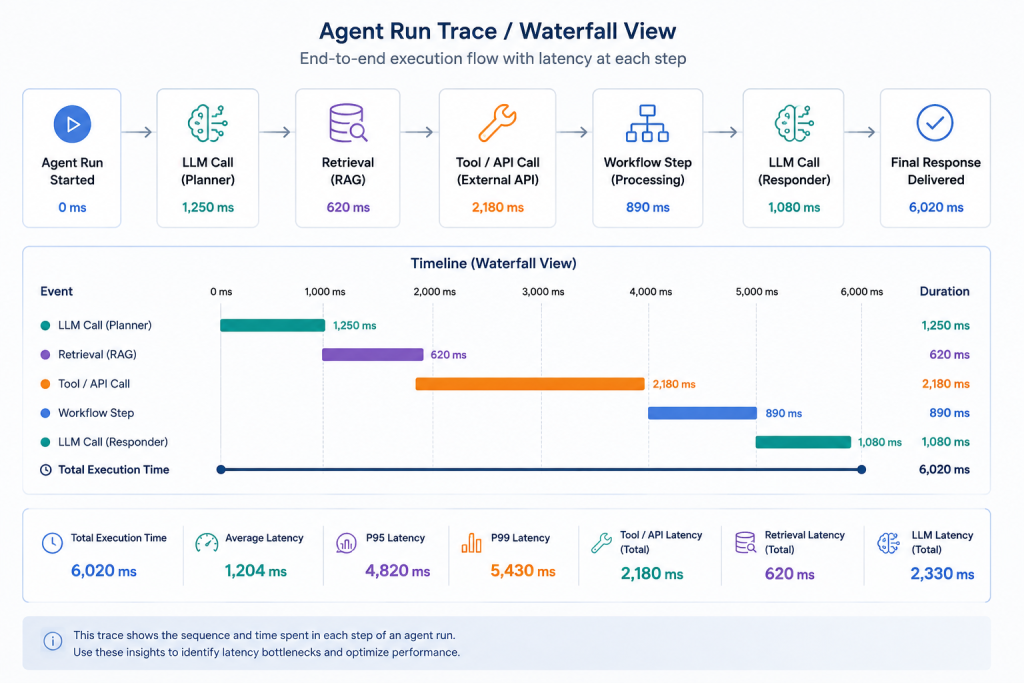
This helps teams identify bottlenecks that would otherwise remain hidden. A slow agent may not have a slow model; the delay could come from a third-party API, repeated tool calls, retrieval, or an unnecessary reasoning loop.
For production systems, latency should also be considered alongside task success and cost. Reducing execution time is useful only when the agent continues to produce reliable results at an acceptable cost.
What an AgentOps Dashboard Should Reveal About Agent Failures
Failure monitoring should go beyond counting application errors. An AI agent can return a successful response while still failing at a deeper level,
for example, by selecting the wrong tool, using stale information, taking an unnecessarily long execution path, or producing an incorrect result. Production monitoring therefore needs visibility into both technical failures and agent behavior.
A useful dashboard should surface:
- Agent failure and completion rates
- Failed runs and failed spans
- Tool and API failures
- Retries and aborted executions
- Failure patterns by workflow, model, or tool
- Quality or evaluation scores
- Individual traces for failed runs
Tracing is particularly important because it allows teams to move from “the agent failed” to “this specific step caused the failure.” A dashboard can use traces to show the sequence of model calls, tool interactions, retrieval steps, and other events within a run.
Teams should also monitor silent failures, where an agent completes a task but produces a poor result. Dynatrace's 2026 global study found that around 50% of agentic AI projects remain in the proof-of-concept or pilot stage, highlighting the importance of reliability before scaling.
The goal is to identify what failed, why it failed, how often it happens, and whether the problem affects the agent's overall reliability.
How Cost, Latency, and Failure Metrics Work Together
Cost, latency, and failure should not be monitored as isolated metrics. Looking at them together gives teams a clearer picture of whether an AI agent is efficient, responsive, and reliable.
For example, an increase in latency may be caused by additional model calls or repeated tool usage, which can also increase the cost of each run.
Similarly, a rise in failures may trigger retries, increasing both execution time and token consumption. A dashboard should make these relationships visible rather than showing each metric in isolation.
Teams can compare metrics such as:
- Cost per successful task
- Latency by task type
- Failure rate by workflow or tool
- Retries and their impact on cost
- Token usage versus task success
- Execution time versus quality or completion rate
AgentOps dashboards can provide high-level metrics such as total cost, tokens generated, fail rate, trace duration, and failed spans, while detailed traces help teams investigate individual runs.
This combined view helps teams identify important trade-offs. A faster agent is not necessarily better if it produces more failures, and a cheaper agent may not be more efficient if it requires repeated retries.
The objective is to optimize cost, speed, and reliability together, based on the actual requirements of each agent workflow.
How to Build an AgentOps Dashboard for Production AI Agents
A production AgentOps dashboard should combine operational metrics with detailed execution traces. This allows teams to identify a problem at the dashboard level and then investigate the specific agent run that caused it.
Current AgentOps dashboards, for example, expose metrics such as total cost, generated tokens, failure rate, event counts, duration, and errors, while session waterfalls show individual LLM calls, tools, actions, and errors.
At a minimum, teams should monitor:
- Cost: Cost per run, token usage, model-level spending, and cost trends.
- Latency: Total execution time, average and percentile latency, and latency by workflow or stage.
- Failures: Failed runs, error rates, retries, and tool or API failures.
- Execution: Model calls, tool calls, steps, and events within each run.
- Quality: Task success, evaluation scores, and poor-output patterns.
- Traces: The complete execution path for debugging and investigation.
The dashboard should allow teams to filter metrics by agent, workflow, model, tool, and task type. LangChain's 2026 research found that 89% of organizations use agent observability, but only 52% run offline evaluations, showing that monitoring still needs to be paired with systematic evaluation.
Every important metric should lead back to a trace, helping teams understand what changed and why.
Implementation checklist
- Define the run boundary, task types, success rules, service targets, and budget limits.
- Instrument agent, model, tool, retrieval, workflow, and evaluation boundaries with consistent trace and span fields.
- Attach agent, prompt, model, tool, release, environment, and evaluation-set versions.
- Validate missing spans, duplicate events, clock skew, token counts, sampling, and pricing calculations before trusting the charts.
- Set thresholds, alert routes, owners, and response steps for cost, latency, technical failure, task failure, and runaway loops.
- Test every dashboard drill-down from summary metric to run set to trace before launch.
How to Use AgentOps Dashboards for Continuous Improvement
An AgentOps dashboard should not be treated as a passive reporting screen. Its real value is helping teams identify patterns, investigate problems, and improve agent behavior over time.
Teams can use dashboard trends to detect rising costs, increasing latency, or growing failure rates. Detailed traces can then help identify whether issues come from model changes, prompt modifications, inefficient tool usage, retrieval problems, or changes in the agent's execution path.
The improvement cycle can follow:
Monitor → Detect → Trace → Diagnose → Improve → Re-evaluate
For example, teams can inspect traces to understand latency increases, examine token usage and model selection when costs rise, and analyze failed runs to identify problematic tools or workflows.
Over time, this creates a feedback loop where production telemetry informs optimization and evaluation, making agent workflows more efficient, reliable, and easier to operate at scale.
How the Johns Hopkins University Agentic AI Program Builds AgentOps Skills
For professionals working with AI agents, understanding how to monitor, evaluate, and improve agent behavior is important for moving from experimentation to production.
The AI Agents course by Johns Hopkins University covers these areas alongside the broader foundations of agentic AI.
Certificate Program in Agentic AI
Learn the architecture of intelligent agentic systems. Build agents that perceive, plan, learn, and act using Python-based projects and cutting-edge agentic architectures.
The program includes AgentOps monitoring and observability, focusing on tracing, logging, feedback, and dashboards that track metrics such as agent latency, costs, and failure rates. It also introduces evaluation approaches for assessing agent performance and identifying areas for improvement.
This practical focus helps professionals understand what happens after an AI agent is deployed, including how to examine execution, identify inefficient or failed steps, and use operational data to improve reliability.
The program connects agent development with monitoring, evaluation, and production readiness, making AgentOps an important skill for building and managing reliable AI agent systems.
How AgentOps Dashboards Support Production AI Agent Management
An AgentOps dashboard should turn operational data into actions that improve agent reliability, efficiency, and performance. Teams can set thresholds for cost, latency, failure rates, and unusual execution patterns, then use traces to identify the underlying issue.
Dashboards can also support continuous improvement by helping teams compare agent versions, review failed runs, and refine prompts, tools, models, or workflows.
The Johns Hopkins University Agentic AI curriculum emphasizes real-time dashboards, continuous feedback, and data-driven debugging for monitoring agent latency, costs, and failure rates.
A simple operational loop is:
Monitor → Detect → Investigate → Improve → Evaluate
This makes AgentOps an ongoing process for keeping AI agents reliable and production-ready.
Final Thoughts
An effective AgentOps dashboard should show more than whether an AI agent completed a task. It should reveal what the agent did, what it cost, how long it took, and where failures occurred.
Connecting cost, latency, and failure metrics with execution traces helps teams identify the specific model call, tool interaction, or workflow step behind a problem.
For production agents, the goal is to balance cost, speed, quality, and reliability. The Johns Hopkins University Agentic AI program covers AgentOps monitoring and observability, tracing, evaluation, and dashboards for agent latency, costs, and failure rates.
Ultimately, effective AgentOps helps teams detect problems, understand agent behavior, and continuously improve production AI systems.
Frequently Asked Questions
1. What is an AgentOps dashboard?
An AgentOps dashboard is a monitoring interface that provides visibility into AI agent executions, costs, latency, failures, tool calls, and other operational signals. It helps teams understand how agents behave in production and investigate problems through execution traces.
2. What metrics should an AgentOps dashboard track?
A production dashboard should track cost, token usage, latency, failure rates, retries, model and tool calls, task success, evaluation results, and execution traces. These metrics help teams assess both operational efficiency and agent reliability.
3. How can teams monitor AI agent costs?
Teams can monitor cost per run, token consumption, model-level spending, and cost by workflow or task. Comparing these metrics over time can reveal expensive workflows, excessive model calls, or inefficient agent loops.
4. Why is latency important for AI agents?
Latency shows how long an agent takes to complete a task. Breaking latency down by model calls, tools, APIs, retrieval, and individual workflow steps helps teams identify bottlenecks and optimize execution.
5. How can an AgentOps dashboard help identify failures?
Dashboards can surface failed runs, error rates, failed tool calls, retries, and recurring failure patterns. Detailed traces can then help teams identify the specific step or component responsible for the failure.
6. Why should cost, latency, and failure be monitored together?
These metrics often influence one another. Retries can increase both cost and latency, while reducing model usage may lower cost but potentially affect quality or reliability. Monitoring them together helps teams make better optimization decisions.
7. Does an observability dashboard stop a runaway agent?
No. A dashboard records behavior and supports alerts. Runtime controls such as step limits, timeouts, budget limits, circuit breakers, approval gates, and kill switches enforce limits during execution. Use both layers for agents which trigger paid calls or external actions.
8. Which AI agents course can help professionals learn AgentOps?
The AI Agents course by Johns Hopkins University covers AgentOps monitoring and observability, including tracing, logging, feedback, and real-time dashboards for monitoring agent latency, costs, and failure rates. It also covers evaluation, security, and production operationalization of agentic AI systems.