- Data Visualization and its Importance
- Data Visualization Tools: Tableau
- Message to Reader: Why Tableau for you?
- Message to Reader: Prerequisites
- Tableau’s Learning Curve
- Tableau Products
- Tableau Environment
- Tableau Desktop Installation
- Tableau Work Space & Menu
- Understanding Datatypes
- Getting Started: File Upload / Import
- Getting Started: Connect to Database
- Must Read
- Hear from Our Successful Learners
Data Visualization and its Importance
Data Visualization is a graphical representation that explains the relationship and behavioural patterns in the data. The goal is to communicate the data analysis through easy visualizations effectively and aesthetically.
With the advent of Industrial Analytics, a paradigm shift has been observed in data-driven decisions. Analytics inevitably play a paramount role in effective decision enablement. Data visualization is an integral part of any analytics, including Data Science. Data visualization compresses a huge amount of virtual data, either big or small, that is difficult for the human brain to grasp and represent the essence of the data. The visual format is easier to understand and identify trends, correlations, anomaly detections, and pattern recognition in data analytics.
An increase in data analytics and data integration has made way for more specialized visual analytical tools. Typically, flat files like excel are very good with data analytics and visualizations but come with their limitations. Specialized software leverage easy operations on both static and live data feeds. Huge computational speeds, self-service functions, and interactive visualizations facilitate users to pull up a report or dashboard and freely drill down to granular levels of information. Integrations and huge data computation from multiple sources are now possible without the knowledge of coding.
To determine the appropriate analytical tool for business it is necessary to consider the below aspects:
- Amount of the data processing
- Frequency and type of reports and structure
- Cost of the solution to determine the right analytical tools.
Visual Analytics focuses on analytical reasoning facilitated by an interactive visual interface. It’s an art of balancing the form (visualizations) and functionality (communicating information).
Also, Enroll Free in Online Tableau Course For Beginners in Hindi
Data Visualization Tools: Tableau
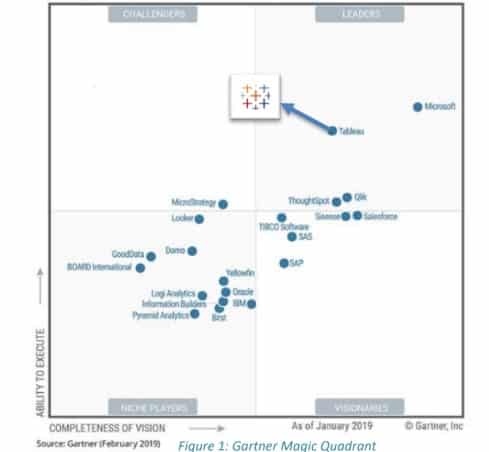
There are multiple data visualization tools such as Google Charts, Tableau, Power BI, Zoho, Sisense, etc., but ‘Tableau’ is often considered the market leader. Tableau Software provides software applications for analytics and visualization. Its technologies include visual query language and hybrid data architecture. It connects, visualizes, and shares data in an efficient, seamless experience from desktop to mobile. You can create and publish dashboards, share them with colleagues, and analyze them using different methods. This is recommended because of its simplified drag-and-drop system, all-day technical support, and flexible package fees.
Data Visualization using Tableau
Learn how to use Tableau for data visualization and transform raw data into meaningful insights. With interactive charts and dashboards, you can easily explore trends and make informed decisions.
Get real results, take the Tableau Quiz.
What makes Tableau a leader in its league?
- Rich Graphical and Visualization Capabilities.
- Integrated support for ‘R & Python’.
- Compatible with Azure, AWS, etc.
- Connects to any data repository from excel to Hadoop clusters.
- Huge community and free resources.
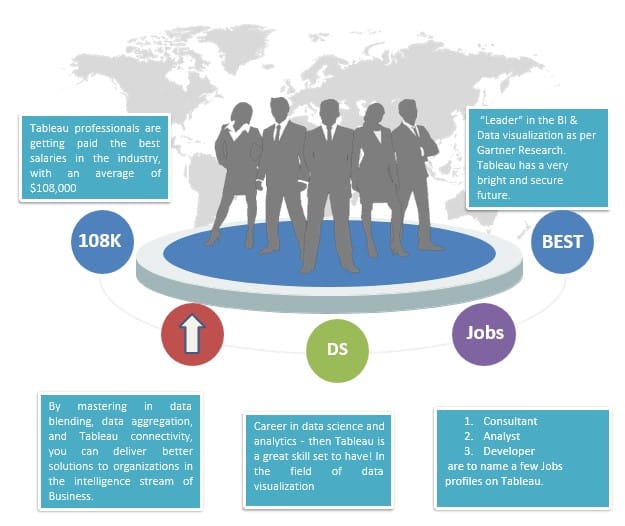
Message to Reader: Why Tableau for you?
Message to Reader: Prerequisites
- Take up tableau free courses
- Knowledge of Basic Charts and Graphs is preferred.
- Knowledge of Excel pivots is an advantage.
- Knowledge of SQL is an advantage.
This guide is intended for ‘Basic and Intermediate Users’ with basic or no prior knowledge of Tableau.
License is a must for using ‘Tableau Desktop software’ after a period of 14 days trial period is over. Data privacy restrictions can be user-defined in ‘Tableau Desktop’.
Tableau offers free one-year Tableau licenses to students at accredited academic institutions through our Tableau for Students program.
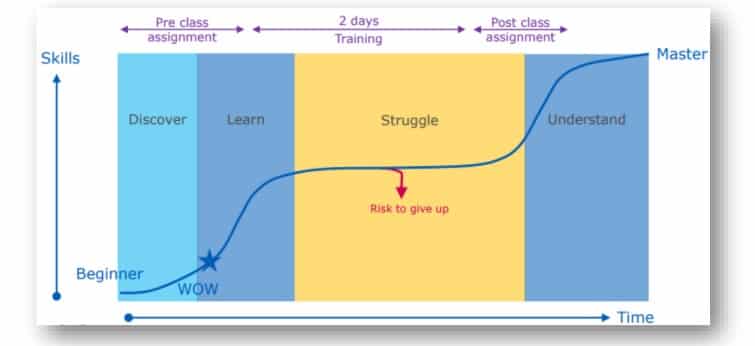
Tableau’s Learning Curve
Message to Reader: The Motive- Sample Dashboards
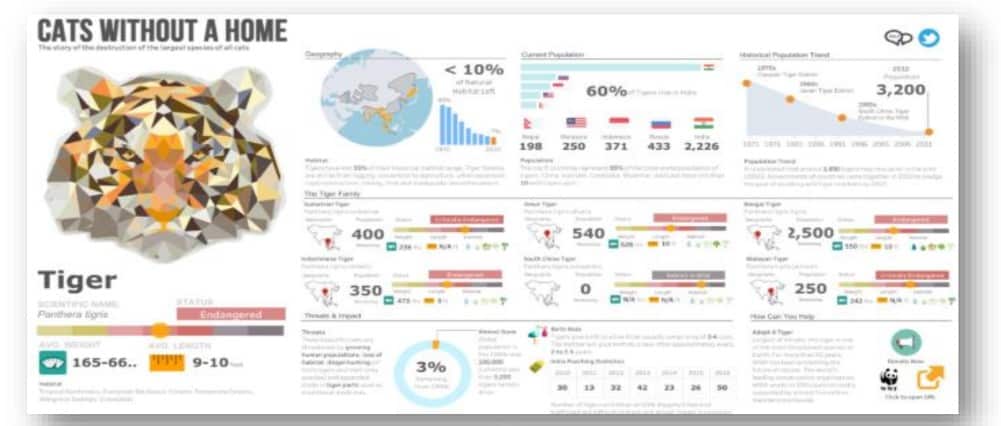
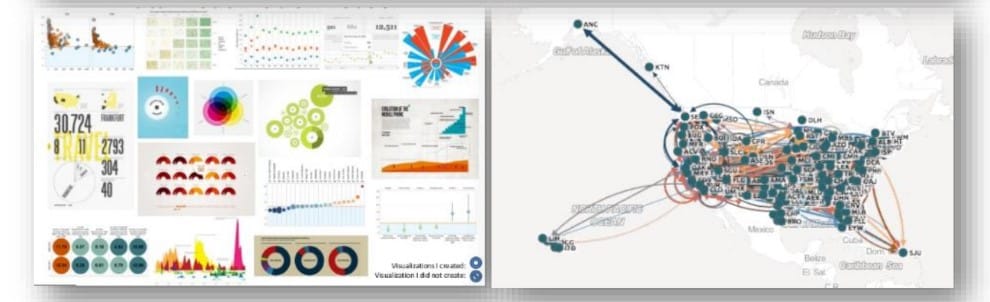

Tableau Products
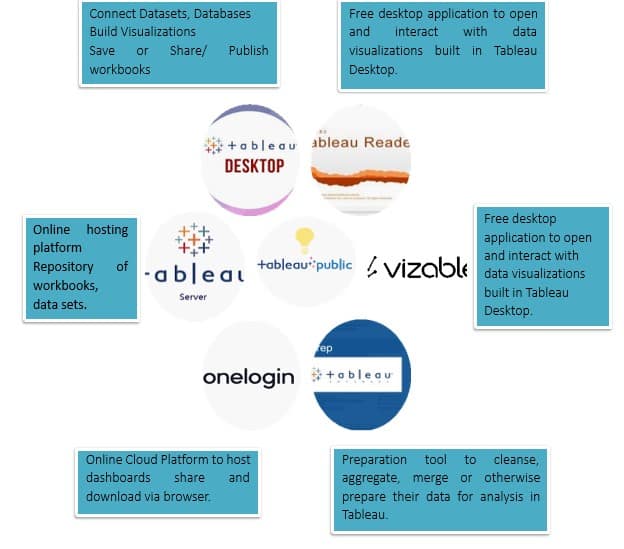
Tableau Environment
Tableau provides a secured and scalable solution for the creation and delivery of web, mobile, and desktop analytics:
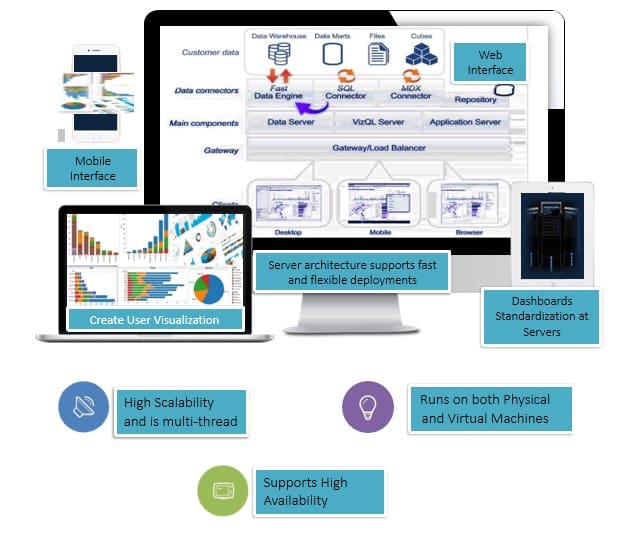
Tableau Desktop Installation
How do you get the Tableau Student version?
Using this Link, follow the procedure shown below:


Please ensure that your laptop's windows configuration is 64bit in order to support the software.
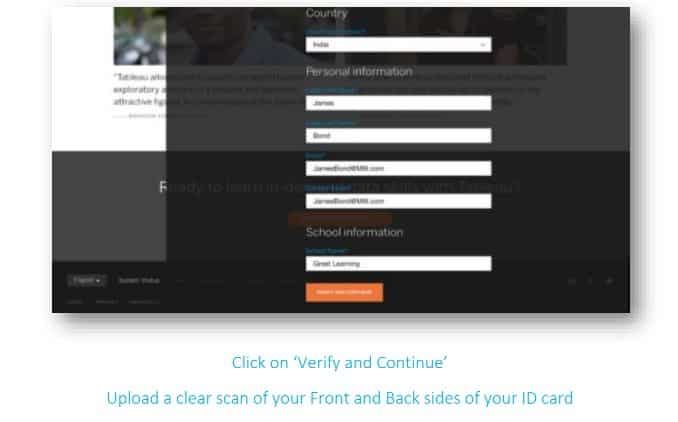
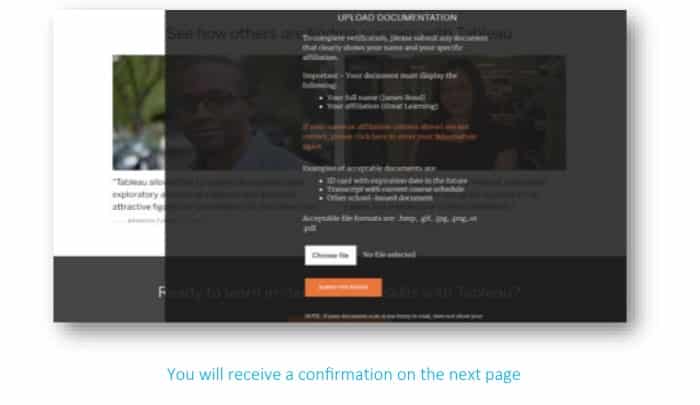
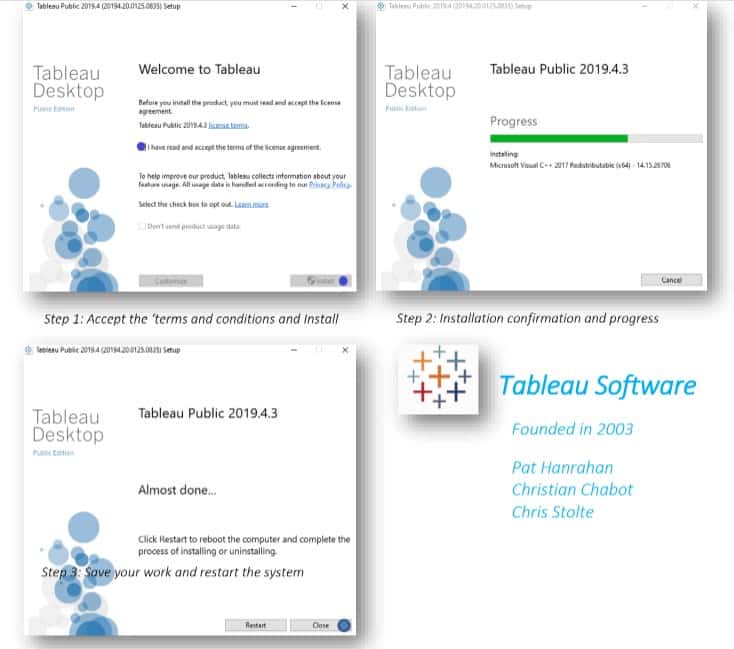
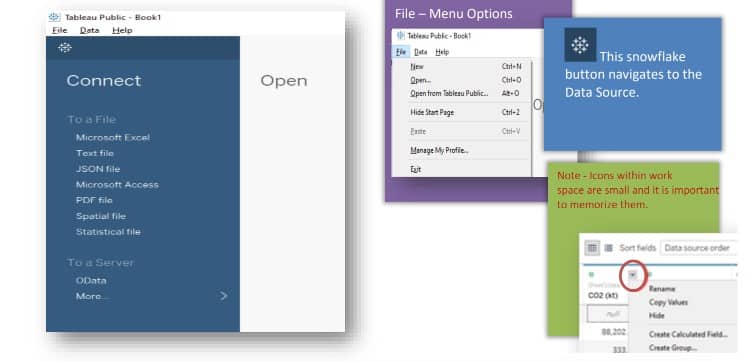
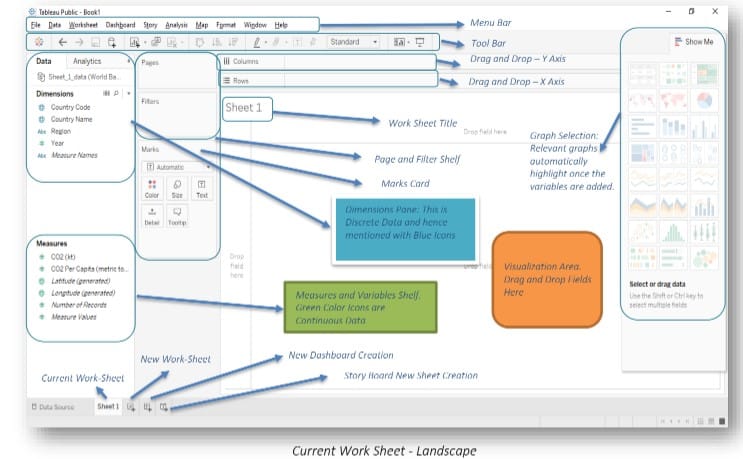
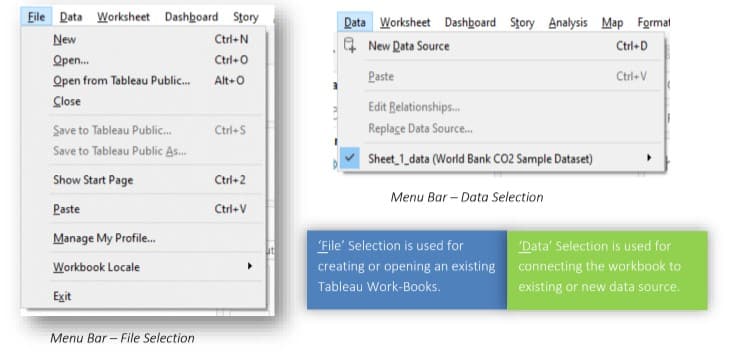
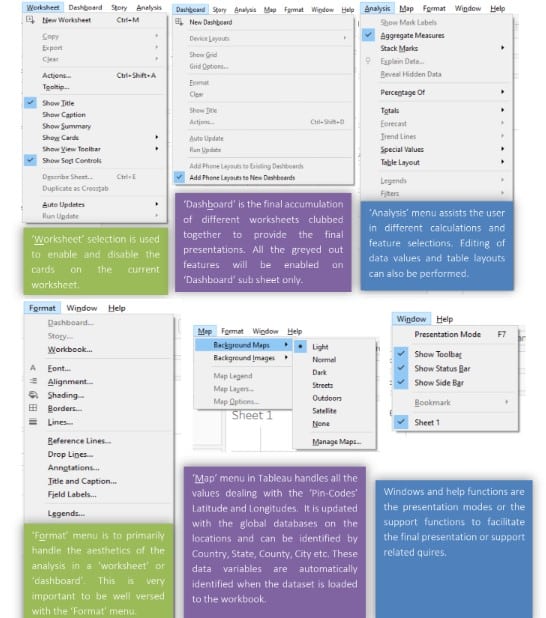
Tableau Work Space & Menu
Understanding Datatypes
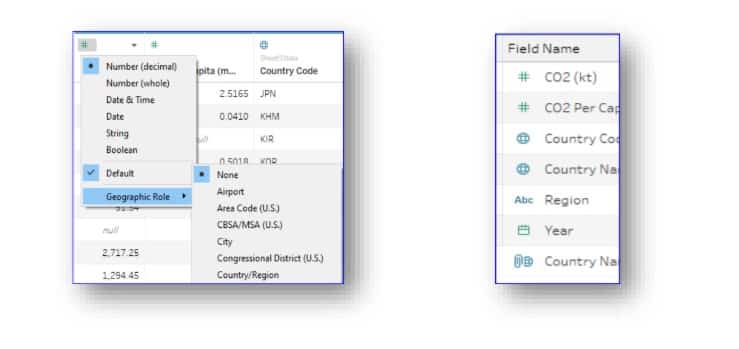
For an appropriate visual representation of the data, it is always necessary to know the variable type and its properties.
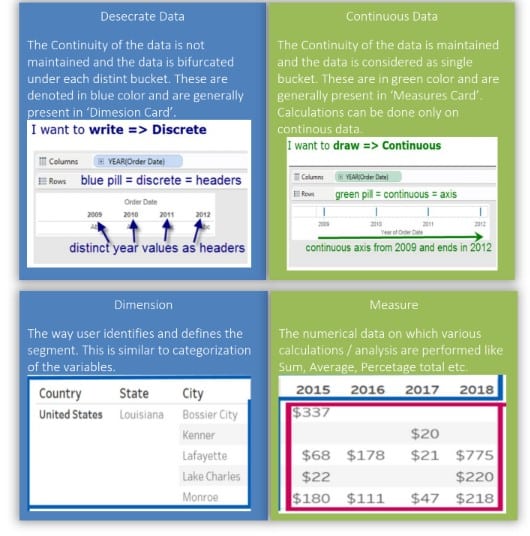
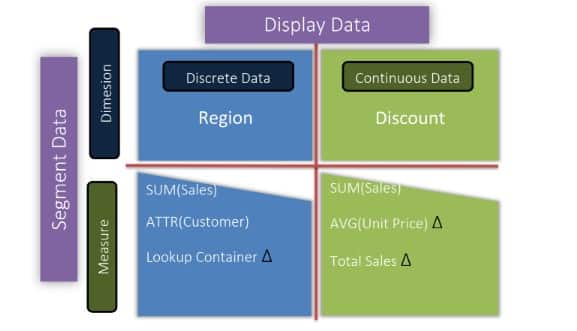
During the file import – tableau automatically assigns the variable type which is denoted by a unique icon. User can change the variable type by selecting the icon and assigning new variable type.
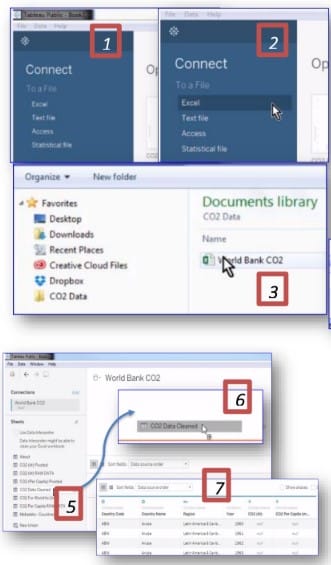
Getting Started: File Upload / Import
This module is a ‘Pictorial Sequence’ representation of individual steps to upload a file. In this example we will start with excel upload.
Step 1: Open the Tableau Interface.
Step 2: Select the import type of file on the Tableau interface.
Step 3: Select the import type of file.
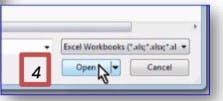
Step 4: Click the Open button to open the file.
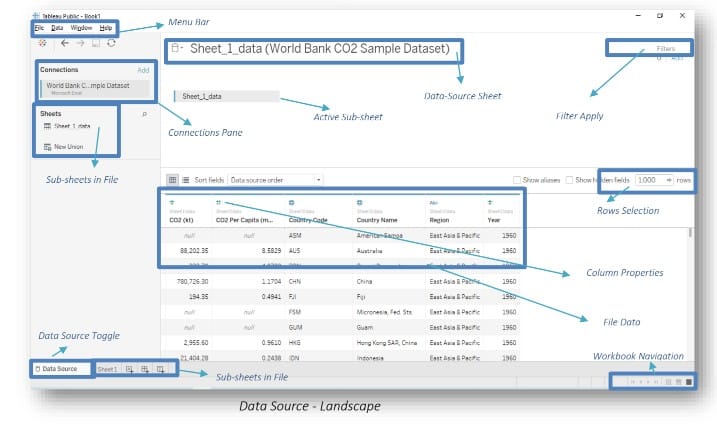
Step 5: Select the relevant sub-sheet from the Data-source page and drag it into
the data pane (Steps 6 & 7).
Similarly, Text, JSON, PDF, spatial, statistical files, etc. can be imported.
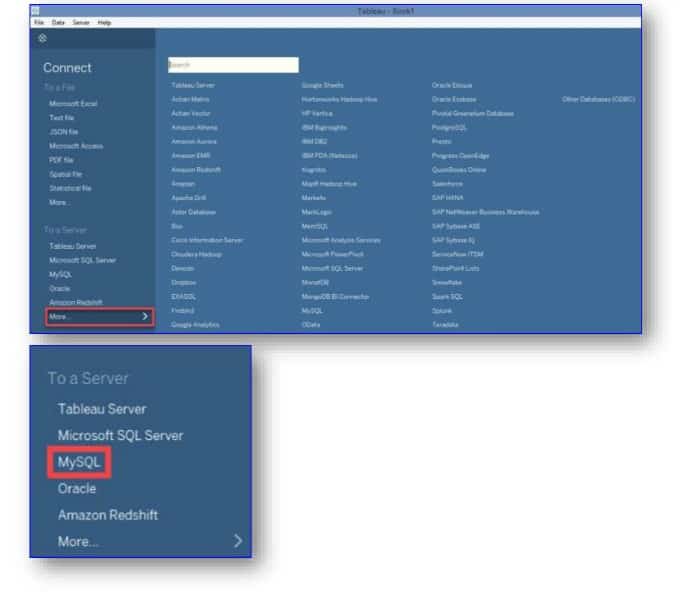
Getting Started: Connect to Database
Tableau can also connect to various databases using its ODBC connector. Tableau has the capability to connect to servers and web connectors. Included below are the step-by-step illustrations of Database connections.
If you found this tutorial helpful and wish to learn more about such content, upskill with Great Learning's PGP - Data Science and Analytics course today!
If you're looking to enhance your skills in data analysis, check out this free Excel certification course designed for beginners. Mastering Excel is essential for creating effective reports before advancing to tools like Tableau.
Must Read
70+ Power BI Interview Questions and Answers
Data Visualization using Power BI
Learn how to transform raw data into meaningful insights with Power BI. This course covers essential visualization techniques to help you create compelling, interactive dashboards and reports.
Hear from Our Successful Learners
From Data Analytics to Real-Time Reporting: My Professional Journey