
- Introduction
- Definition and Significance
- Brief Mention of Types of Chi-Square Tests
- Basics and Application
- Quick Overview of When to Use Chi-Square
- How It Works
- Brief on Degrees of Freedom and Significance
- Applications and Interpretation
- Interpreting Results - Null Hypothesis Decision
- Tips, Examples, and Conclusion
- Recap and Future Trends
Introduction
Statistical analyses serve as the backbone of informed decision-making across various disciplines. One such powerful tool, the Chi-Square Test, holds a key position in the realm of statistics. Whether you're a student delving into research or a professional navigating data-driven insights, understanding the Chi-Square Test is essential.
Definition and Significance
The Chi-Square Test is a statistical method designed to determine if there's a significant association between two categorical variables. In essence, it helps us explore whether the distribution of observed categorical data differs from what we would expect by chance. This significance test is widely used in diverse fields such as social sciences, biology, business, and more.
The significance of the Chi-Square Test lies in its ability to unveil patterns and dependencies within categorical data sets. By doing so, it empowers researchers and analysts to draw meaningful conclusions from seemingly complex information. Whether investigating market trends, exploring epidemiological patterns, or understanding survey responses, the Chi-Square Test plays a crucial role in unraveling the intricacies of categorical relationships.
Brief Mention of Types of Chi-Square Tests
While the Chi-Square Test is a versatile statistical tool, it comes in different forms tailored to specific scenarios. Two primary types include:
- Goodness-of-Fit Test: This variant assesses whether the observed categorical data matches an expected distribution. It is particularly useful when examining the fit of a model to observed data.
- Test of Independence: This test investigates whether there is a significant association between two categorical variables. It is commonly applied to contingency tables to determine if the variables are independent or if there's a relationship between them.
In the upcoming sections, we'll delve deeper into these types, exploring their applications, calculations, and real-world examples. As we unfold the intricacies of the Chi-Square Test, you'll gain a comprehensive understanding of its utility and significance in the field of statistics.
Basics and Application
Now that we've laid the groundwork with an introduction to the Chi-Square Test, let's delve into its basics and practical applications. Understanding the hypotheses and knowing when to employ this statistical tool is essential for harnessing its analytical power.
Hypotheses and Common Applications
In the Chi-Square Test, the hypotheses revolve around the independence of variables. The null hypothesis (H₀) typically assumes no association or independence between the categorical variables under examination. Conversely, the alternative hypothesis (H₁) posits that there is a significant association between the variables.
Common Applications:
- Biological Studies: Assessing the distribution of traits or genetic markers.
- Market Research: Analyzing consumer preferences and purchasing behaviors.
- Social Sciences: Examining the relationships between demographic variables.
- Quality Control: Ensuring products meet certain specifications.
These applications highlight the versatility of the Chi-Square Test across various domains. Whether you're exploring the genetic makeup of a population or scrutinizing survey responses, the Chi-Square Test can be a valuable ally in uncovering meaningful patterns.
Quick Overview of When to Use Chi-Square
Knowing when to employ the Chi-Square Test is crucial for efficient statistical analysis. Here are scenarios where the Chi-Square Test is particularly useful:
- Categorical Data: When dealing with categorical variables and the data can be tabulated into a contingency table.
- Comparing Observed vs. Expected Frequencies: If you want to compare the distribution of observed categorical data with the distribution expected under a null hypothesis.
- Independence Testing: When investigating whether there is a significant association between two categorical variables.
- Large Sample Size: Particularly effective with larger sample sizes, the Chi-Square Test tends to be robust even with moderate departures from assumptions.
In the next section, we'll explore the mechanics of how the Chi-Square Test works, including the calculation process and the nuances of interpreting its results. Buckle up as we navigate the intricacies of this statistical journey.
How It Works
Now that we've established the significance of the Chi-Square Test and its applications, let's dive into the mechanics of how this statistical powerhouse actually works. Understanding the calculation process, the concept of degrees of freedom, and the significance levels is key to harnessing the full potential of the Chi-Square Test.
Calculation of Chi-Square
The crux of the Chi-Square Test lies in calculating a test statistic called the Chi-Square (X2) statistic. The formula varies slightly between the two main types of Chi-Square Tests: Goodness-of-Fit and Test of Independence.
For Goodness-of-Fit Test:
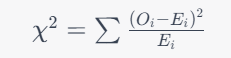
For Test of Independence:

Here, Oi represents the observed frequency, Ei is the expected frequency, and the summation is done over all categories. The larger the resulting X2 value, the more the observed frequencies deviate from the expected frequencies.
Brief on Degrees of Freedom and Significance
Degrees of Freedom (df): The degrees of freedom in a Chi-Square Test are crucial in determining the critical value from the Chi-Square distribution table. For the Goodness-of-Fit Test, df is calculated as the number of categories minus one ( d f = k – 1, where k is the number of categories. In the Test of Independence, it's calculated as (r – 1) x (c – 1), where r and c are the number of rows and columns in the contingency table.
Significance Levels: The Chi-Square Test results are often interpreted with the help of a significance level (α). Commonly chosen values for α include 0.05 or 0.01, representing the probability of rejecting the null hypothesis when it is actually true. If the calculated Chi-Square statistic exceeds the critical value corresponding to the chosen significance level, you may reject the null hypothesis.
In the upcoming section, we'll explore specific applications of the Chi-Square Test, starting with the Goodness-of-Fit Test and then moving on to the Test of Independence. Get ready for some hands-on understanding of how this statistical tool unravels patterns and relationships within categorical data.
Applications and Interpretation
With a solid understanding of how the Chi-Square Test works, let's now explore its specific applications through the lenses of the Goodness-of-Fit Test and the Test of Independence. Additionally, we'll delve into the critical task of interpreting the results to make informed decisions about our hypotheses.
Goodness-of-Fit and Test of Independence
Goodness-of-Fit Test:
This variant of the Chi-Square Test is instrumental when you have a single categorical variable and want to assess whether the observed data fits an expected distribution. For instance, in genetics, you might use this test to evaluate whether observed genetic traits follow the expected Mendelian ratios.
Test of Independence:
Contrastingly, the Test of Independence is employed when you're dealing with two categorical variables and wish to determine whether they are related or independent of each other. This is frequently used in social sciences to analyze survey responses, investigating if there's a significant association between two variables like gender and voting preferences.
Interpreting Results - Null Hypothesis Decision
Once you've conducted the Chi-Square Test, the next crucial step is interpreting the results and making decisions regarding the null hypothesis. Here are the key steps in this process:
- Calculate Chi-Square Statistic: Plug in the observed and expected frequencies into the appropriate formula and obtain the Chi-Square (X2) statistic.
Determine Degrees of Freedom: Based on the type of Chi-Square Test conducted, calculate the degrees of freedom (d f). - Compare with Critical Value: Consult a Chi-Square distribution table with the chosen significance level (α) to find the critical value. If the calculated (X2) statistic exceeds the critical value, you may reject the null hypothesis.
- Assess Significance: If the p-value is provided, compare it with the significance level. A p-value less than the significance level indicates that you can reject the null hypothesis.
- Draw Conclusions: Based on the comparison, either reject or fail to reject the null hypothesis. Formulate conclusions about the relationship between variables or the fit of the data to the expected distribution.
Tips, Examples, and Conclusion
As we approach the conclusion of our journey through the Chi-Square Test, let's explore some practical tips for effective application, delve into quick examples spanning various fields, and then wrap up with a recap and a glance toward future trends.
Data Preparation and Common Mistakes
Data Preparation Tips:
- Ensure that your data is appropriately categorized into nominal or ordinal variables.
- Organize your data into a contingency table for the Test of Independence.
- Verify that the assumptions of the Chi-Square Test are met, especially in terms of sample size.
Common Mistakes to Avoid:
- Misinterpreting the null hypothesis: Remember, a p-value less than the significance level allows you to reject the null hypothesis.
- Using the Chi-Square Test inappropriately for small sample sizes or continuous data.
- Ignoring the assumptions of the test, such as the independence of observations.
Quick Examples Across Fields
Social Sciences:
Imagine a survey exploring the relationship between gender and political affiliation. The Test of Independence could be employed to determine if there's a significant association between these categorical variables.
Biomedical Research:
In a genetic study, the Goodness-of-Fit Test could be applied to assess whether observed ratios of different alleles conform to expected Mendelian ratios.
Business and Market Research:
Consider a market survey investigating the preference for a product across different age groups. The Test of Independence could reveal if age and product preference are related.
Recap and Future Trends
In this comprehensive exploration of the Chi-Square Test, we've covered its definition, significance, applications, and interpretation. To recap:
- Definition and Significance: The Chi-Square Test is a powerful tool for analyzing relationships between categorical variables.
- Basics and Application: Understanding hypotheses and knowing when to use the Chi-Square Test is crucial for effective statistical analysis.
- How It Works: From calculating the Chi-Square statistic to understanding degrees of freedom and significance levels, we've delved into the mechanics.
- Applications and Interpretation: Explored the Goodness-of-Fit and Test of Independence, and how to interpret results to make informed decisions.
Looking ahead, the field of statistics is dynamic. Advances in technology and data science will likely lead to more sophisticated methods and tools. As you incorporate the Chi-Square Test into your analytical toolkit, staying abreast of these trends will be key to unlocking even more profound insights from your data.
In conclusion, the Chi-Square Test stands as a cornerstone in statistical analysis, unraveling patterns and dependencies within categorical data. Armed with the knowledge from this guide, you're well-equipped to navigate the intricacies of this test and extract meaningful conclusions from diverse datasets. Happy analyzing!