Contributed by: Prashanth Ashok
LinkedIn Profile: https://www.linkedin.com/in/prashanth-a-bb122425/
Data availability in today’s world is a big boon. However, analyzing them to our needs is the biggest challenge. To be able to analyze the vast resources of data, understanding and describing the data is crucial.
There are different methods through which we can describe data. Statistics, a branch of mathematics, helps us while collecting, organizing, visualizing and interpreting data.
Statistics Course for Data Science and Analytics
Learn statistical methods crucial for data science, including regression and hypothesis testing, to extract valuable insights from data.
In this blog, we shall aim to understand the description of any data using statistical concepts. This involves the following questions:
- What is Descriptive Statistics?
- Types of Descriptive Statistics
- Skewness
- Kurtosis
- Association between two variables
What is Descriptive Statistics?
Descriptive Statistics, as the name suggests, describes data. It is a method to collect, organize, summarize, display and analyze sample data taken from a population. Descriptive Statistics, unlike inferential statistics, is not based on probability theory. It paves the way to understand and visualize data better. If you want to learn basic concepts, then you can take up free descriptive statistics course from Great Learning Academy.
Also Read: Inferential Statistics- An Overview
Types of Descriptive Statistics
Descriptive Statistics is classified into Measures of Central Tendency and Measure of Dispersion.
A. Measures of Central Tendency
1. Mean/ Average
This measure of central tendency summarizes the data, by considering a value which is an estimate of the total data set. It helps us to ascertain the spread in variables between the minimum and maximum values.
Sample Mean
Population Mean
Sample Data: 12,18,25,69,45
Sample Mean: [(12+18+25+69+45)/5] = 33.80
Population Data: 55,46,78,12,18,33,28,45,25,69,66
Population Mean: [(55+46+78+12+18+33+28+45+25+69+66)/11)] = 43.18
2. Median
- Median is the middle item in a data set arranged in ascending/descending order.
- If there are n observations then the Median = (n+1)/2 th observation.
- Computational Rule.
- If n is odd, then (n+1)/2 is an integer.
- If n is even, then use an average of n/2 and (n/2) +1th observation.
3. Mode
- Mode is the highest occurring observation.
- The greatest frequency can occur at two or more different values.
- If the data has only two modes, the data is bimodal.
- If the data has more than two modes, the data is multimodal.
4. Percentiles and Quartiles
- The Pth percentile in the ordered set is that value below which lies P% (P percent) of the observations in the set.
- The position of the Pth percentile is given by (n + 1) P/100, where n is the number of observations in the set.
- Quartiles are special names to percentiles.
Q1 = 25th percentile
Q2 = 50th percentile = median
Q3 = 75th percentile
Comparison of Mean, Median, and Mode
| Mean | Median | Mode |
| Defined as the arithmetic average of all observations in the data set. | Defined as the middle value in the data set arranged in ascending or descending order. | Defined as the most frequently occurring value in the distribution; it has the largest frequency. |
| Requires measurement on all observations. | It does not require measurement on all observations. | It does not require measurement on all observations. |
| Uniquely and comprehensively defined. | Cannot be determined under all conditions. | Not uniquely defined for multi-modal situations. |
| Affected by extreme values. | Not affected by extreme values. | Not affected by extreme values. |
| Can be treated algebraically. In other words, Means of several groups can be combined. | Cannot be treated algebraically, meaning, Medians of several groups cannot be combined. | Cannot be treated algebraically, since Modes of several groups cannot be combined. |
B. Measures of Dispersion
1. Range
- The range of a data set is the difference between the largest and smallest data values.
- It is the simplest measure of variability.
- It is very sensitive to the smallest and largest data values.
- Range = X max – X min
2. Interquartile Range (IQR)
- The interquartile range of a data set is the difference between the third quartile and the first quartile.
- It is the range for the middle 50% of the data.
- It overcomes the sensitivity to extreme data values.
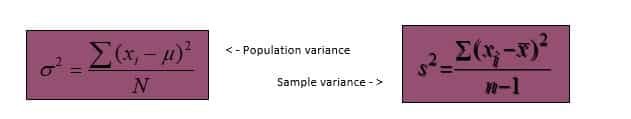
3. Variance
- The variance is a measure of variability that utilizes all the data.
- It is based on the difference between the value of each observation (xi) and the mean (x for a sample, m for a population).
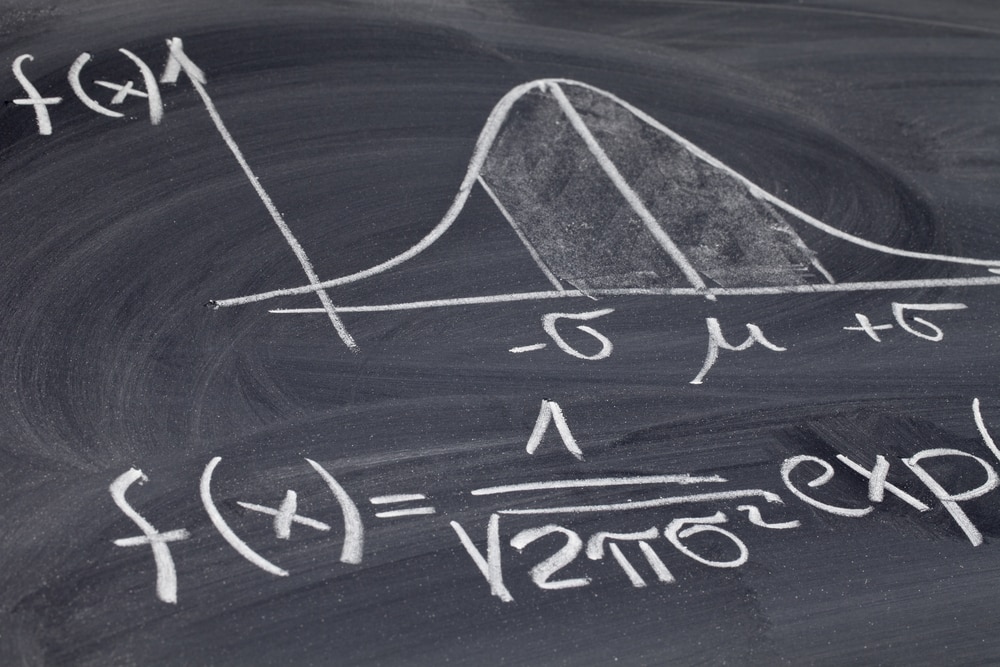
4. Standard Deviation
- The standard deviation of a data set is the positive square root of the variance.
- It is measured in the same units as the data, making it more easily comparable, than the variance, to the mean.
- If the data set is a sample, the standard deviation is denoted s.
- If the data set is a population, the standard deviation is denoted s (sigma).
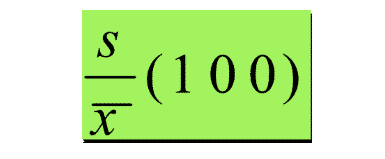
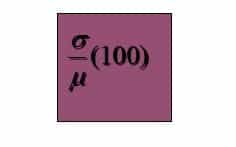
5. Coefficient of Variation
- The coefficient of variation indicates how large the standard deviation is in relation to the mean.
- If the data set is a sample, the coefficient of variation is computed as follows:
- If the data set is a population, the coefficient of variation is computed as follows:
Also Read: What is Data Science?
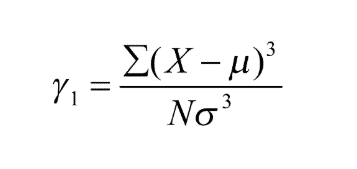
Skewness
Skewness characterizes the degree of asymmetry of a distribution around its mean.
The concept of skewness is mainly used to understand the distribution of the data and steps taken to normalize the data for further building of machine learning models.
In case of negatively skewed data, Mean<Median<Mode. This indicates, more data points are to the right of the curve where the data has very high values in large numbers.
In case of positively skewed data, Mode<Median<Mean. This means that more data points are to the left of the curve where the data has very low values in large numbers.
Measure of Skewness
Also Read: Top 9 Job Roles in the world of Data Science
Kurtosis
Kurtosis characterizes the symmetric distribution through the relative peaks or flatness of the curve.
The main difference between Skewness and Kurtosis is:
Skewness measures the degree of the slope in the frequency distribution.
Kurtosis measures the degree of thickness in the tails of the distribution curve.
There are 3 types of Kurtosis:
- Platykurtic (relatively flat)
- Mesokurtic (normal)
- Leptokurtic (relatively peaked)
Measure of Kurtosis
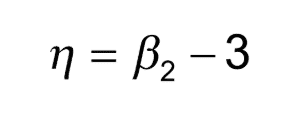
Where,
is the fourth standardized moment or the fourth degree.
Association between the two variables
- Scatter plot
- Scatter Plots are used to identify underlying relationships among pairs of data sets.
- The plot consists of many scattered points, each point representing an observation.
Based on the distribution in the dataset and the points in the scatter plot, we can infer the outliers in the dataset and the relationship between 2 variables.
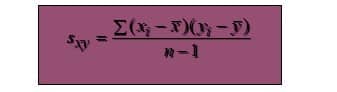
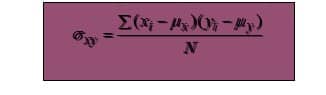
2. Covariance
- The covariance is a measure of the linear association between two variables.
- Positive values indicate a positive relationship.
- Negative values indicate a negative relationship
If the data sets are samples, the covariance is denoted by:
If the data sets are populations, the covariance is denoted by:
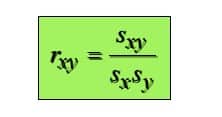
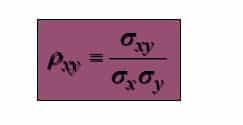
3. Correlation Coefficient
Correlation measures the strength and direction of linear relationship between variables.
- The coefficient can take on values between -1 and +1.
- Values near -1 indicate a strong negative linear relationship.
- Values near +1 indicate a strong positive linear relationship.
If the data sets are samples, the coefficient is-
If the data sets are populations, the coefficient is-
Upon understanding the statistical methods, one can summarize and visualize the basic features of data to proceed with modelling or predicting the data.
If you wish to pursue a career in data science, upskill with Great Learning’s PG program in Data Science.