You are likely here because your dataset is full of text labels (like cities, colors, or product names), and your machine learning model is throwing errors because it only understands numbers.
Before we fix your model errors, you need to understand what you are actually feeding it. In the world of analytics, Data is simply recorded reality.
However, machines process reality in two very different languages:
- Quantitative Data (Numbers): This is language machines speak natively. "Temperature is 25 °C" or "Salary is $50,000."
- Qualitative Data (Categories): This is the language humans speak. "The car is Red," "The city is London," or "The customer is Satisfied."
Here is the conflict: You cannot feed a word into a mathematical equation. You cannot calculate 'Red × 5'. This is where Categorical Data becomes the most critical, and frustrating, part of the data science pipeline. If you don't translate it correctly, your analysis fails.
You can Read More about Types of Data.
What is Categorical Data? (The Basics)
Categorical data represents groups or qualities. Unlike numerical data (height, weight, salary), you cannot do math on it directly. You cannot subtract "New York" from "London."
There are only two types you need to care about. Knowing the difference changes how you process them.
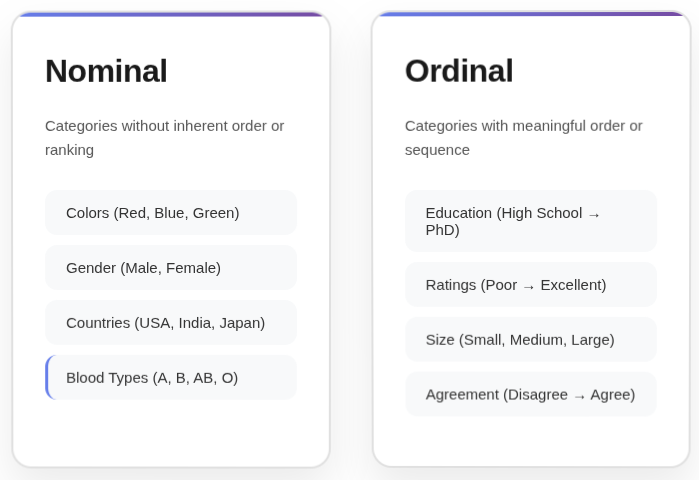
A. Nominal Data (No Order)
These are variables with no natural ranking.
- Examples: Colors (Red, Blue, Green), Cities (Paris, Tokyo, Delhi), Payment Method (Card, Cash).
- The Trap: If you assign numbers like 1, 2, 3 to these, the machine thinks 3 is "greater" than 1. It thinks "Green" is three times better than "Red." This destroys model accuracy.
B. Ordinal Data (Ordered)
These have a clear, logical rank.
- Examples: T-Shirt Size (S, M, L, XL), Education Level (High School, Bachelor, PhD), Satisfaction (Low, Medium, High).
- The Strategy: The order matters here. You want the model to know that PhD > High School.
Master Python for ML & Data Science
Learn Python for data science and machine learning to unlock endless opportunities. Its ease of use and powerful libraries help you transform data into insights & build intelligent systems seamlessly.
How to "Translate" It for Machines (Encoding)
We call the translation process Encoding. Here are the three industry-standard methods we use in real-world pipelines.
Method 1: One-Hot Encoding (OHE)
This is the most common method for Nominal Data. You create a new column for every unique category and fill it with 0s and 1s.
- How it works:
- Original:
["Red", "Blue"] - New Column "Is_Red":
[1, 0] - New Column "Is_Blue":
[0, 1]
- Original:
- When to use: When you have a small number of categories (e.g., Gender, Payment Type).
- The Pain Point: If you have a column like "Zip Code" with 5,000 unique codes, OHE will create 5,000 new columns. This creates a massive, slow dataset (called the "Curse of Dimensionality").
Method 2: Label / Ordinal Encoding
This assigns an integer to each category.
- How it works: Small = 1, Medium = 2, Large = 3.
- When to use: Strictly for Ordinal Data where rank matters.
- Warning: Do not use this for Nominal data (like cities), or your model will find patterns that don't exist.
Method 3: Target Encoding (The Expert's Choice)
This is what we use when One-Hot Encoding creates too many columns.
- How it works: You replace the category name with the average value of the target (what you are predicting) for that category.
- Example: If you are predicting House Price, and "Neighborhood A" has an average house price of $500k, you replace "Neighborhood A" with the number 500,000.
- Benefit: It keeps your dataset small.
- Risk: It can lead to "overfitting" (the model memorizes the data). We solve this by adding slight random noise or using "smoothing."
The "Hidden" Problems No One Tells You About
Tutorials usually stop at One-Hot Encoding. In the real world, that is where the problems start.
The "High Cardinality" Nightmare
"Cardinality" just means the number of unique categories.
- Scenario: You have a "User_ID" column or "Product_ID" with 1 million unique values.
- Solution: Do not encode these. Usually, unique IDs are noise and should be dropped. If the ID contains info (like a prefix
US-123), extract the prefix (US) and encode that instead.
The "Rare Label" Issue
Some categories appear only once or twice (e.g., a specific typo like "Calfornia" instead of "California").
- The Fix: Before encoding, group any category that appears less than 1-2% of the time into a new category called "Other." This stabilizes your model.
The "New Data" Crash
You train your model on data containing cities "A" and "B". In production, a user enters city "C".
- The Crash: Your code will fail because it doesn't know how to encode "C".
- The Fix: Always have a handle_unknown='ignore' setting in your code (available in Scikit-Learn) or strictly treat unseen categories as "Other."
Comparison Table: Which to Choose?
| Data Type | Cardinality (Count) | Recommended Method | Python Tool |
|---|---|---|---|
| Nominal | Low (<10) | One-Hot Encoding | pd.get_dummies or OneHotEncoder |
| Nominal | High (>100) | Target Encoding / Frequency Encoding | category_encoders library |
| Ordinal | Any | Ordinal Encoding | OrdinalEncoder |
| Tree Models | High | Native Support | CatBoost / LightGBM |
Summary for your Workflow
- Identify: Is it Nominal (Names) or Ordinal (Ranks)?
- Clean: Group rare categories into "Other."
- Choose:
- Use One-Hot for nominal data with few options.
- Use Ordinal Encoding for ranked data.
- Use Target Encoding if you have hundreds of categories.
- Automate: Use pipelines (like Scikit-Learn
ColumnTransformer) so your production code handles new data automatically.
FAQs
These are the edge cases that tutorials rarely cover, but we encounter frequently in production environments.
Q1: Can data look like a number but act like a category?
A: Yes, and this is a common trap. Zip Codes (e.g., 90210) and Phone Area Codes look like numbers, but they are Nominal Categories. You cannot add two zip codes to get a "better" zip code. Always check if the math makes sense; if adding the numbers is meaningless, treat it as categorical.
Q2: How do I handle "Missing Values" in categorical data?
A: You cannot fill missing text with an "average" (mean) like you do with numbers. You have two options:
- Imputation: Fill it with the Mode (the most frequent category).
- Explicit Labeling: Fill it with a new category called "Unknown." In many real-world scenarios, the fact that data is missing is actually a signal in itself (e.g., a user hiding their income bracket).
Q3: What if I am using Deep Learning (Neural Networks)?
A: Deep Learning uses a specialized technique called Entity Embeddings. Instead of simple 0s and 1s, the network learns a multi-dimensional vector representation for each category. It can learn that "Paris" and "London" are similar (both European capitals) while "Tokyo" is different, purely based on the data context. This is far more powerful than standard encoding.
Q4: Does the specific algorithm I choose change how I handle categories?
A: Absolutely.
- Linear Regression / Logistic Regression: Strict requirements. You must encode to numbers (usually One-Hot) and avoid the "Dummy Variable Trap" (multicollinearity).
- Tree-Based Models (Random Forest, XGBoost): More forgiving.
- CatBoost / LightGBM: These modern algorithms can handle text categories natively without you doing any manual encoding. They often outperform manual methods because they calculate statistics on the categories during training.