
Key Takeaways
- Outlier detection identifies data points that are different from the rest of the data.
- This is important for data cleaning, anomaly detection, and maintaining the quality of data.
- Statistical methods, machine learning algorithms, and visualization tools like charts/graphs are used to catch outliers.
- Handling outliers properly increases the accuracy of the model and can avoid incorrect results.
- Nowadays, there are many tools and libraries that can easily do outlier detection automatically.
What is Outlier Detection?
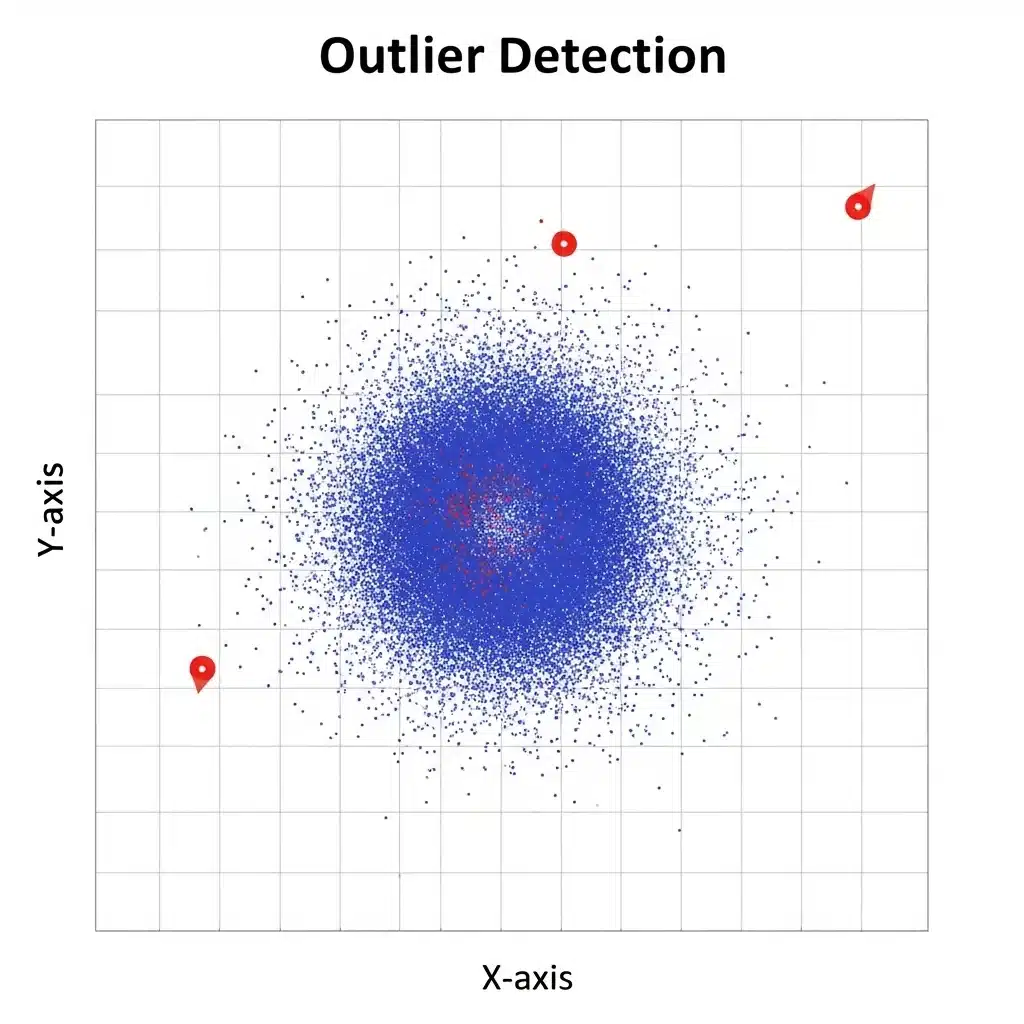
Outlier detection means identifying data points that are very different from the rest of the data. These different looking points are called "outliers."
These outliers can distort your analysis, reduce the accuracy of machine learning models, and give incorrect results. So understanding and handling them properly is very important for data analysis and making the right decisions.
Why is Outlier Detection important?
Outlier detection is used in many real-life tasks:
Fraud Detection:
For example, if someone's card suddenly makes a purchase of a huge amount in another country, then it can be an outlier. The system can flag such transactions so that fraud can be caught quickly.
Quality Control:
If a product is of a very different shape or size from other products, then it can be a defect. With the help of outlier detection, such manufacturing problems can be caught quickly.
Data Preprocessing in Machine Learning:
If outliers are removed or handled properly before training a machine learning model, then the result of the model is more accurate and reliable.
Statistics Course for Data Science and Analytics
Learn statistical methods crucial for data science, including regression and hypothesis testing, to extract valuable insights from data.
Types of Outliers
There are different types of outliers in data. There are three main types:
1. Global Outliers
These are the points that are the most different from the rest of the values in the entire dataset.
Example: If all students in a test score between 60 and 90, and one student scores just 0 marks — that is a global outlier.
2. Contextual Outliers
These points look strange only when you see them in a particular situation or context.
Example: If a website suddenly gets a lot of traffic at 3 am. This may be normal for a global e-commerce website, but for a local shop site it would be an outlier.
3. Collective Outliers
These are outliers that look normal when viewed individually, but when many data points are viewed together, they show a strange pattern.
Example: Imagine a company's stock price is constantly increasing little by little every day, while the rest of the market's stocks keep going up and down. Then this constantly increasing pattern would be considered a collective outlier.
Outlier Detection Methods
There are many techniques for identifying outliers — some are simple (like statistics), and some are complex (like machine learning). Below we will look at three types of techniques:
1. Statistical Methods
These methods use the numbers in the data (mean, standard deviation, etc.) to catch unusual values.
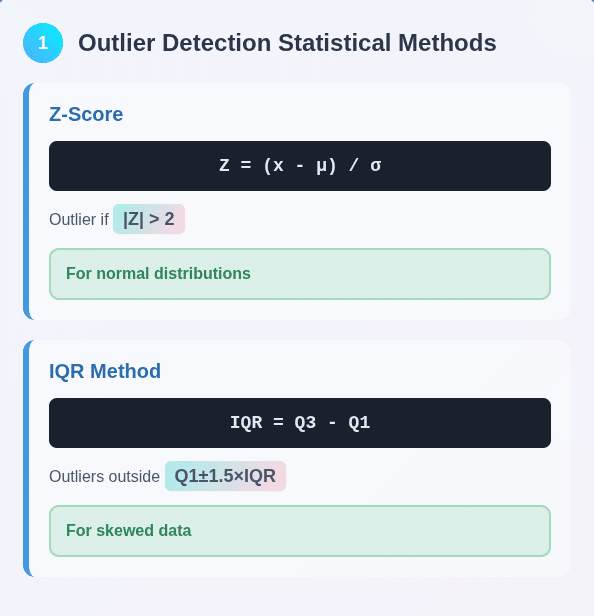
A. Z-Score Method
What it is: The Z-score tells how far a data point is from the average (mean) — in standard deviation.
How it works:
Formula: Z = (x − μ) / σ
Where:
- x = data point
- μ = mean
- σ = standard deviation (standard gap)
When is an outlier:
If the Z-score is more than +2 or -2 (i.e. ∣Z∣ > 2 or 3), then it is considered an outlier.
When to use: When the data is in a normal distribution i.e. bell-shaped.
B. IQR Method (Interquartile Range Method)
What is it: This method divides the data into 4 parts and looks at the range of the middle parts.
How it works:
- Q1 = Below 25% of the data
- Q3 = Below 75% of the data
- IQR = Q3 − Q1
- Outliers = Data that is below Q1 − 1.5×IQR or above Q3 + 1.5×IQR.
When to use: When the data is skewed or not normal.
2. Machine Learning Methods
These methods help to catch outliers hidden in large and complex datasets.
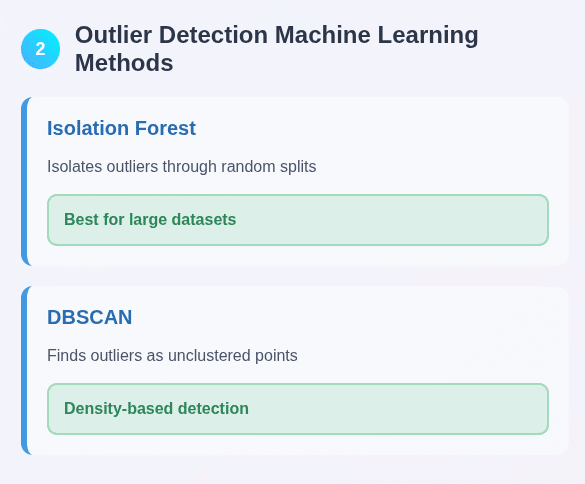
A. Isolation Forest
How it works: This algorithm repeatedly divides the data in a random manner (like the branches of a tree).
Outliers get isolated quickly because they are far away from the rest.
When to use: When you have a lot of data and it is multi-dimensional.
B. DBSCAN (Density-Based Clustering)
What it does: This algorithm groups dense data together.
How outliers are detected: Points that do not fall into any group and remain alone — are considered noise or outliers.
3. Visualization Techniques
Sometimes outliers can be easily identified by looking at graphs. This method is fast and intuitive.
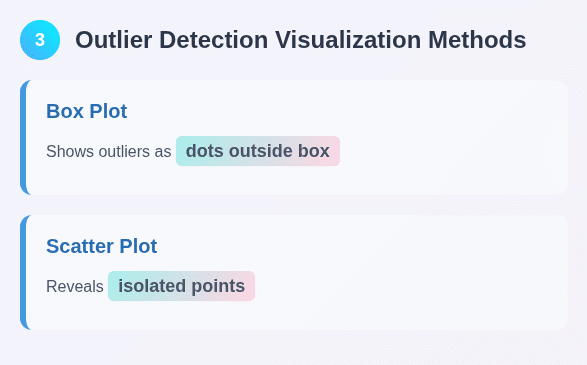
A. Boxplot (Shows the entire spread of the data)
- A boxplot shows where the data is concentrated and where it is not.
- Outliers usually appear outside the box like small round dots.
- These show those values which are far away from the rest.
B. Scatter Plot (Shows the relationship between two variables)
- This plot shows how two variables are related to each other.
- If a data point is far away from all the other points, then it may be an outlier.
- Useful when you want to identify relationship-based outliers.
C. Histogram (how many times a value is repeated)
- This plot shows how many times a value occurs (frequency).
- If a single bar is drawn at the edge of the graph, it can show an outlie
- Especially when there are no other values on that side.
Read: All Data Visualization Techniques
Step-by-Step Outlier Detection
If you want to find outliers in your dataset, here is a simple and practical way:
1. Understand the Data
Take a good look at your data before you start. Know what each column (feature) means and what its normal range is. If you know your domain (field), you can easily spot values that look odd.
2. Visualize the Data
Use charts like boxplot, histogram, scatter plot.
With these, you can see at a glance which points look very different from the rest — these could be your possible outliers.
3. Choose a Method
Choose a method based on the type and pattern of your data:
- If the data is normally distributed, the Z-score method is good.
- If the data is a little skewed or the distribution is not fixed, try methods like IQR (Interquartile Range) or Isolation Forest.
4. Detect Outliers
Now apply the method you chose to your dataset. This involves running code or using a specific feature in a software tool to flag outliers.
5. How to handle the outliers
Now you decide what to do with these outliers:
- If they are a clear error, remove them
- If they are missing or wrong, impute them (meaning replace them with a correct value)
- If they represent an important, rare event, they should be kept — not removed
Challenges in Outlier Detection
1. Determining Thresholds
The threshold you use to identify outliers is often subjective. It can be different in every field — so domain knowledge will come in handy.
2. High Dimensionality
If your data has a lot of columns (features), the meaning of "distance" gets messed up. In such a case, it becomes difficult to find outliers - this is called the "curse of dimensionality".
3. Differentiate between Noise and Outliers (Noise vs. Outliers)
Sometimes it becomes difficult to distinguish between normal noise (random messed up data) and real outliers. If you accidentally remove important data (thinking that it is an outlier), then the analysis may be wrong.
Applications of Outlier Detection
Outlier detection is used in many different industries:
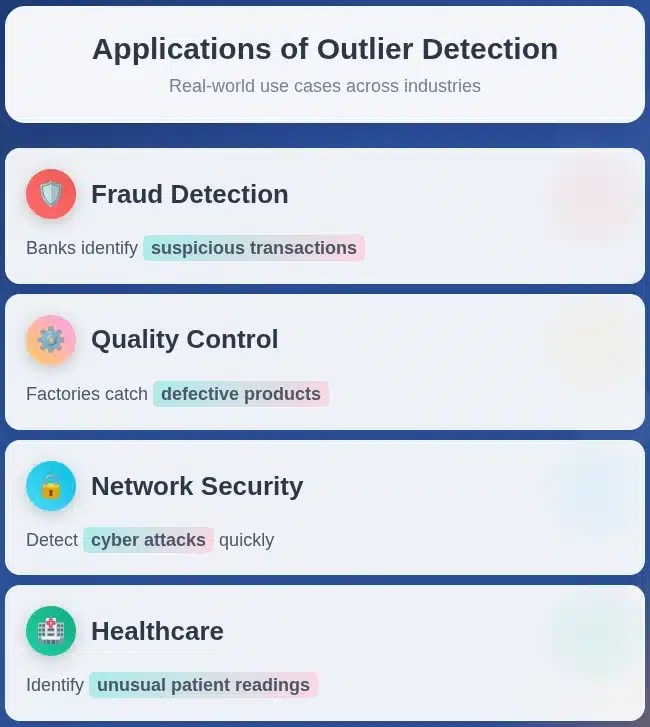
Fraud Detection: Banks and financial companies use it to identify strange or suspicious transactions, such as overpriced purchases, fake insurance claims, or credit card fraud.
Quality Control: In factories, it is used to catch damaged or defective products. Sensor data or the size of the product can tell if something is wrong.
Network Security: If a system is suddenly experiencing strange logins, heavy traffic, or any unknown activity, outlier detection can help catch a cyber attack quickly.
Healthcare: Outlier detection can help doctors identify strange patient readings, mistakes in treatment, or a very rare disease pattern.
Tools & Libraries
There are many great tools available for outlier detection on platforms like Python and R:
Python Libraries:
- SciPy: A library that provides statistical methods like Z-score.
- Scikit-learn: Provides machine learning algorithms like IsolationForest, DBSCAN, and OneClassSVM.
- Pandas: Used to clean and prepare data.
- Matplotlib/Seaborn: Outliers can be easily seen with graphs and charts.
R Libraries:
Libraries like outliers, AnomalyDetection, and dbscan are used in R.
Specialized Software:
Tableau, Power BI, and some data science platforms have ready-made outlier detection features, which make analysis faster.
Final Thoughts
Outlier detection is an important way to maintain the quality of our data.
If you handle outliers correctly, then:
- The data will not produce false conclusions
- The machine learning model will be more accurate and reliable
So, start including Outlier Detection in your data analysis process.
Frequently Asked Questions (FAQ)
Q: What is the difference between Outlier and Anomaly?
Answer: The words "Outlier" and "Anomaly" are often used interchangeably, but there is a slight difference between them:
- Anomaly is a larger term, it means anything that is different from the norm.
- An outlier is a specific type of anomaly — a data point that is far away or different from the rest of the dataset.
That is, every outlier is an anomaly, but every anomaly is not necessarily a statistical outlier.
Question: Should we always remove outliers?
Answer: No! It is not always right to remove outliers.
Some outliers occur by mistake (such as typing mistakes in data entry), so it is right to remove or fix them. But some outliers represent really rare events that may provide important information.
So whether to remove, change or keep an outlier depends on:
- Why did it happen?
- What effect does it have on your analysis or model?
Question: What effect do outliers have on machine learning models?
Answer: Outliers can mess up machine learning models because they:
- Disrupt the rules of the model
- Make predictions inaccurate
Example:
- If a very different value comes in a regression model, it can stretch the regression line and make the whole relationship look wrong.
- In clustering, outliers can lead to the formation of wrong clusters.
That is why it is important to have robust models and handle outliers wisely.