R Programming in Hindi Free Course
R Programming in Hindi
Learn a statistical and graphical programming language popular amongst data scientists in Hindi
Instructor:
Mr. Bharani AkellaAbout this course
R programming has gained massive popularity among data analysts, an extensive statistical and graphical programming language. R programming is free. It can run on several macOS, Unix, and Windows platforms. With the help of R programming, we can create new statistical methods quickly and in a straightforward manner. In this R programming in Hindi course, you can master the fundamentals of R programming. It acts as a comprehensive guide. This course covers various essential R concepts, such as R-Studio, vectors, lists, matrices, data frames, data manipulation and visualization, and many more. To help understand the applications of all the concepts, a case study is also discussed.
Several highly established universities across the globe have collaborated with Great Learning to offer postgraduate programs in Data Science and Analytics. Register yourself in world-class online data science courses and secure a Postgraduate Certificate in the highest-rated Data Analytics courses from dream universities. The university partners of these programs are the University of Texas at Austin, Massachusetts Institute of Technology (MIT), Northwestern School of Professional Studies, PES University, and SRM University. Some of these programs lecture you about the R programming language and cover all the important topics necessary to learn Data Science and Analytics.
Course outline
Operators in R
In this module, you will understand the types of Operators in R. you will learn about assignment operators, arithmetic operators, relational operators, and logical operators with suitable code examples.
Factor and Dataframe in R
This module begins with explaining what a factor is and will help you understand it through an example. The second part of this section talks about what dataframes are and why they are essential. You will then work with sample codes to understand dataframes better.
Data Manipulation in R
The section begins by defining what data manipulation is with an example. You will then understand the role of the DPLYR package in data manipulation and work with its methods, functions, and operators to alter and fetch data in order to organize data and make it more readable in R in the second part of this section.
Data Visualization in R
You will understand what data visualization is at the beginning of this section and then continue to understand it through ggplot2. You will also learn to stack and represent layers using histogram, bar graph, scatter point, and box plot through ggplot2 and also look at the demonstrated code snippet to understand data visualization better.
Case study
This section explains the Cardio Good Fitness case study and demonstrates a solution to help you understand descriptive statistics using the Jupyter notebook.
Get access to the complete curriculum once you enroll in the course
What our learners enjoyed the most
Easy to Follow
66% of learners found the course easy to follow
Our course instructor

Mr. Bharani Akella
Data Scientist
Frequently Asked Questions
Will I receive a certificate upon completing this free course?
Is this course free?
What does R stand for in R programming?
R is a programming language and environment commonly used for statistical analysis, data analytics, graphics, scientific research, and reporting. R programming was developed by Ross Ihaka and Robert Gentleman at the University of Auckland, New Zealand in 1993. R programming is now developed by the R Development Core Team. R is freely accessible under the GNU General Public License and is similar to the S language. This programming language was named R, based on the principal letter of the first name of the two R creators (Robert Gentleman and Ross Ihaka), and halfway a play on the name of the Bell Labs Language S.
R is an accessible programming tool made up of a collection of libraries, discovered to investigate the data. R provides a wide range of tools to build the right model for your data.
Because of its expressive syntax structure and simple-to-use interface, it has gained popularity in recent years.
Is Python better than R programming?
R and Python are both open-source and most popular programming languages with a huge community. New libraries or tools are added persistently to their respective index. R is primarily utilized for statistical analysis and whereas Python offers a more general approach to data science.
R and Python are cutting edge as far as programming language oriented towards data science. Learning the two of them is, obviously, the ideal solution. R and Python need a time investment, and such luxury is not available for everybody. Python is a broadly useful language with a readable syntax. R, notwithstanding, is built by statisticians and encompasses their specific language.
Key Differences:
The essential objective of R is Data analysis and Statistics whereas the main objective of Python is Deployment and Production.
R is mostly used for analyzing statistics, while Python gives a more universal approach to data science.
R clients mainly comprise Scholars and R&D professionals while Python users are mostly Programmers and Developers.
R provides adaptability to use available libraries whereas Python provides adaptability to construct new models from scratch.
R language is hard to learn at the beginning while Python is Linear and smooth to learn
R language is coordinated to Run locally while Python is very much integrated with apps
Both R and Python can deal with huge database sizes.
R programming can be run on the R Studio IDE while Python can be run on Spyder and Ipython Notebook IDEs
R coding language consists of different packages and libraries like tidyverse, ggplot2, caret, zoo whereas Python consists of packages and libraries such as pandas, scipy, scikit-learn, TensorFlow, caret
Is it easy to learn R programming?
This is a troublesome question to reply to. Many researchers and analysts are learning R as their primary language to solve their data analysis needs. That’s the power of R programming, it is simply straightforward to learn as you go on learning. All you require is data and a clear intent to make a conclusion based on the investigation of that data.
In fact, R is developed on top of the S programming language that was initially intended as a programming language that would help learn to program while playing around with data. However, developers that come from a Python, PHP, or Java background may find R unusual and confuse at the beginning. The syntax that R uses is quite different when compared to common programming languages. While R has all the required capabilities for a programming language, you will not wind up yourself writing a great deal of if conditions and loops while composing code in the R language. There are other programming constructs such as vectors, lists, frames, data tables, matrices, etc. that permit you to perform changes on data in bulk.
R is an increasingly famous programming language, especially in the world of data analysis and data science. In any case, learning R can be a frustrating task if you’re not sure how to move toward it. Usually, it’s the consequence of a mismatch between what’s motivating you to learn and how you’re actually learning. Learning R can be extraordinary for your career.
Data science is a quickly growing field with high salaries. The greater part of the top tech firms hires R coders for data-science-related occupation job roles. R is being used at organizations across the globe by every industry that performs analytics. Generally, there has been a genuinely even split in the Data Science community. Typically, data scientists with grounded academic or statistical backgrounds prefer R, whereas data scientists who had more of a programming background will tend to learn Python.
At the point when you need to do hefty statistical analysis or graphing, R’s you're go-to. With R programming language normal mathematical operations like matrix multiplication work straight out of the box. On the other hand, Python makes replicability and accessibility easier than R.The uplifting news is R is developed by academics and scientists. It is designed to answer statistical problems, machine learning, and data science. Also, R is the right tool for data science in view of its powerful communication libraries. Besides, R is bundled with many packages to compute time series analysis, panel data, and data mining there are not better tools compared to R.
How do I start coding in R?
R is one of the most famous languages in 2020 and is widely used in finance, business, and academia. For a complete beginner, it’s easy to learn and start R programming in Hindi within a couple of weeks. Here’s how to get started.
Consume R Content : R-bloggers is the main place to find blogs about R. R programming for Data Science by Garrett Grolemund and Hadley Wickham is the best introductory book on learning R. YouTube will be the great explainer videos for visual learners.
Take An Online Course : Clearly, Great Learning provides an R programming course in Hindi and we are huge enthusiasts of online courses for learning data science! Something imperative to know about R is that its functionality is split across packages.
Set up your R Environment: To work with R, we suggest installing R, RStudio, and git, and you may have to customize RStudio and your R profile too. Watch our hands-on training R programming online free course.
If you’d prefer to use R without installing anything, you can sign up for RStudio Cloud for free.
Work on R projects or different R programming examples: There’s no viable replacement for hands-on experience with R using real data—you’ll likely want to develop your own portfolio of data science projects to learn R programming.
Continue Expanding Your R Skills : Keep building and growing your R skills—but look out for common pitfalls. The R Inferno by Patrick Burns is an exemplary text about normal entanglements and a pleasant, short read.The R mailing lists are a decent place to ask questions if you are stuck. Despite the fact that email lists may feel completely antiquated now, the main advantage is that a lot of individuals who’ve been using R for decades are on the list to answer to you, including the R-Core group that develops R. Signing up for the R-help mailing list is a smart idea if you’re curious about learning R.
Similarly, as with any other language, you are required to practice and refine your R skills to get comfortable and become familiar. Study up on regular interview questions in R programming or machine learning. Stay positive, keep at it, and you’ll be well headed to landing a job in data science and analytics.
How difficult is R programming?
R has a reputation of being difficult to learn due to the fact that it is radically different from other analytics software. Some are an unavoidable byproduct of its extreme power and adaptability. Furthermore, as with any software, some is due to design choices that, looking back, could have been something better. Quite a few years ago, R was a troublesome language to master as it was confusing and not as organized as the other programming tools. To overcome this significant issue, Hadley Wickham built a collection of packages called tidyverse. Data manipulation becomes trivial and innate. Creating a graph was not that troublesome any longer.
R can implement the best algorithms for machine learning. Packages like Keras and TensorFlow allow to make high-end machine learning methods and R programming also provides a package to perform Xgboost, one of the best algorithms for Kaggle competition. R can communicate with the other language like it is possible to call Python, Java, C++ in R. The universe of big data is also open to R. You can interface R with different databases like Spark or Hadoop. At last, R has evolved and permitted parallelizing operations to accelerate the computation. In fact, R was complained about using only one CPU at a time. But the parallel package lets you perform tasks in various cores of the machine.
Can I learn R with no programming experience?
Yes. At Great Learning, we've had numerous learners start with no coding experience and land on to get positions as data analysts, data scientists, and data engineers. R is a great programming language for beginners to learn, and you don't need any prior experience with code to get it up.
These days, R is easier to learn than any other programming language ever thanks to the tidyverse collection of packages. The tidyverse is a collection of amazing tools for accessing, cleaning, manipulating, analyzing, and visualizing data with R programming. This Great Learning R programming tutorial in Hindi provides a great introduction to R programming.
Do I need to learn Python before R?
Python was originally evolved as a programming language for software development later the data science tools were added, so individuals with a computer science or software development background often find Python comes more naturally to them.
R has a set of packages known as the Tidyverse, which provide amazing yet simple-to-learn tools for importing, manipulating, visualizing, and reporting on data. Using these tools, people with no programming or data science experience can become gainful more quickly than in Python.
If data science in your organization will fundamentally be conducted by a devoted group with programming experience, Python has a slight bit of leeway. If you have many employees who don't have a data science or programming background, yet who actually need to work with data, R has a favorable advantage.
How long does it take to learn R programming?
It depends on your programming experience and eagerness to learn and practice. If you have prior experience in coding any other programming language, it takes 7 days to learn R programming paying at least 3 hours of time a day. If you are a beginner, it will take one week to clear the basics, provided you are practicing 3 hours per day.
If you are looking for an online course to learn R programming, check out this R programming in Hindi.
Where can I learn the online R programming language?
Take R Programming in Hindi Course by Great Learning helping you master fundamental and core concepts of R Programming and help pave the way for a career in Data Science in R Programming. Great Learning’s R programming in Hindi course provides 2.5hrs of video content that takes students to go through the fundamental R programming skills necessary to analyze data. Skills covered in this course are R Basics, Data Structures, Data Manipulation, Data Visualization. You can learn R programming completely online for free.
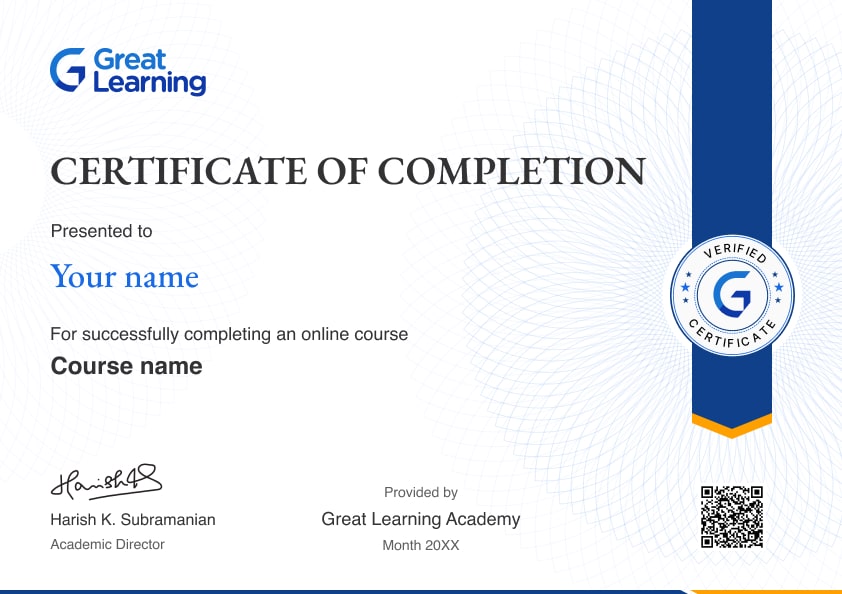
Will I get a certificate after completing this R Programming in Hindi free course?
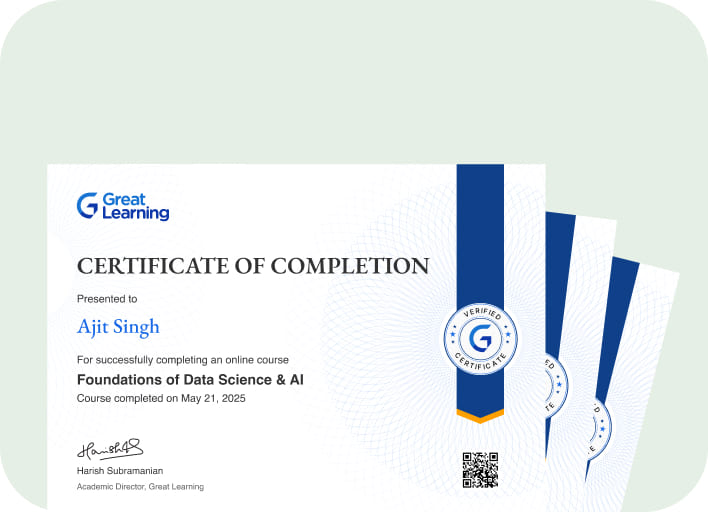
Yes, you will get a certificate of completion for R Programming in Hindi after completing all the modules and cracking the assessment. The assessment tests your knowledge of the subject and badges your skills.
How much does this R Programming in Hindi course cost?
It is an entirely free course from Great Learning Academy. Anyone interested in learning the basics of R Programming in Hindi can get started with this course.
Is there any limit on how many times I can take this free course?
Once you enroll in the R Programming in Hindi course, you have lifetime access to it. So, you can log in anytime and learn it for free online.
Can I sign up for multiple courses from Great Learning Academy at the same time?
Yes, you can enroll in as many courses as you want from Great Learning Academy. There is no limit to the number of courses you can enroll in at once, but since the courses offered by Great Learning Academy are free, we suggest you learn one by one to get the best out of the subject.
Why choose Great Learning Academy for this free R Programming in Hindi course?
Great Learning Academy provides this R Programming in Hindi course for free online. The course is self-paced and helps you understand various topics that fall under the subject with solved problems and demonstrated examples. The course is carefully designed, keeping in mind to cater to both beginners and professionals, and is delivered by subject experts.
Great Learning is a global ed-tech platform dedicated to developing competent professionals. Great Learning Academy is an initiative by Great Learning that offers in-demand free online courses to help people advance in their jobs. More than 5 million learners from 140 countries have benefited from Great Learning Academy's free online courses with certificates. It is a one-stop place for all of a learner's goals.
What are the steps to enroll in this R Programming in Hindi course?
Enrolling in any of the Great Learning Academy’s courses is just one step process. Sign-up for the course, you are interested in learning through your E-mail ID and start learning them for free online.
Will I have lifetime access to this free R Programming in Hindi course?
Yes, once you enroll in the course, you will have lifetime access, where you can log in and learn whenever you want to.
 4.52
4.52






 (1).jpg)
.jpg)





 (1).png)





.png)

.png)

.png)
.png)
.png)
.png)
.png)
.png)
.png)


.png)
.png)
.png)



.png)


.png)
.png)
.png)


.jpg)
.png)
.png)

.png)
.jpg)

.jpg)
.jpg)
.jpeg)
.jpg)
.jpg)
.png)
