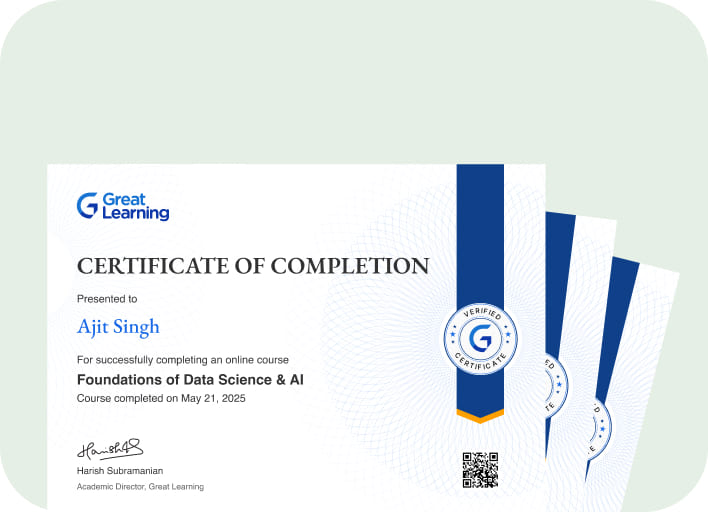
Earn a certificate & get recognized
Data Visualisation with Python
Learn and apply your Matplotlib and SeaBorn library knowledge to solve Data Science with Python
Instructor:
Mr. Gurumoorthy PattabiramanData Visualisation with Python
12.6K+ learners enrolled so far
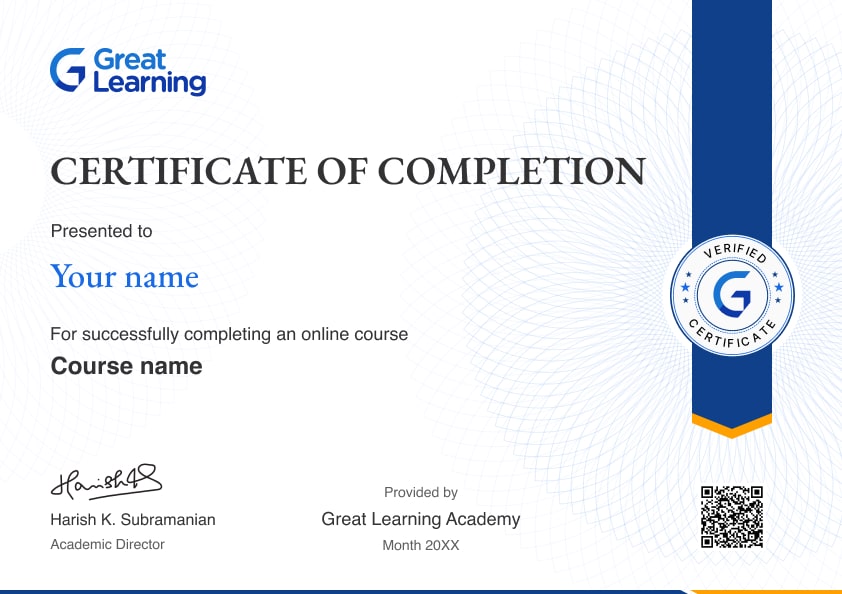
Stand out with an industry-recognized certificate
10,000+ certificates claimed, get yours today!
Get noticed by top recruiters
Share on professional channels
Globally recognised
Land your dream job
Skills you will gain
Matplotlib in Hindi
Seaborn in Hindi
Key Highlights
Get free course content
Master in-demand skills & tools
Test your skills with quizzes
About this course
Data Visualization paves the way for a clearer picture of the delivered information, and it gives the information a visual context with graphs or maps making it more appealing. Data Visualization appears more natural for the human mind to comprehend, hence making it easier to recognize the trends, patterns, and outliers in large data sets.
In this free course, You will first get introduced to Data Visualization with Python using Matplotlib. You will then get introduced to the plots in Matplotlib like line plot, bar plot, scatter plot, histogram, box plot, violin plot, pie chart, and doughnut chart. You will briefly understand all these plots of Matplotlib and what role they play. You will then get an introduction to Data Visualization using SeaBorn. You will also look into the different plots in SeaBorn like distplot or histogram, joint plot, box plot, pair plot, and more. By knowing all these plots, you will get an insight into how to project various Data Visualization techniques in different Python methods. This Data Visualization with Python in Hindi Free Course will help you learn various Data Visualization techniques with the help of well-known Python libraries like Matplotlib and Seaborn. Enroll in this free course today and get completion certificate
Check out Great Learning’s top-rated Data Science Online Courses. Enroll in the best Degree and PG program, explore vast concepts of Data Science, and achieve certifications on completing the enrolled courses.
Course outline
Visualisation with Matplotlib
Visualisation with Seaborn
Get access to the complete curriculum once you enroll in the course
Stand out with an industry-recognized certificate
10,000+ certificates claimed, get yours today!
Get noticed by top recruiters
Share on professional channels
Globally recognised
Land your dream job

Data Visualisation with Python

3.0 Hours
Beginner
12.6K+ learners enrolled so far
Get free course content
Master in-demand skills & tools
Test your skills with quizzes
Learner reviews of the Free Courses


What our learners enjoyed the most
Skill & tools
70% of learners found all the desired skills & tools
Our course instructor

Mr. Gurumoorthy Pattabiraman
Faculty, Data Science & ML, Great Learning
Frequently Asked Questions
Will I receive a certificate upon completing this free course?
Is this course free?
How is Data Visualization done in Python?
Data Visualization is the form of graphical representation of the data and information, and there are multiple efficient libraries in Python that support this idea. For example, take Matplotlib and Seaborn, and both of these Python libraries are efficient in graphical representations. You can find various plots that can be utilized for Data Visualization.
How can I learn Data Visualization in Python for free?
You can find various sources that are providing courses related to Data Visualization. You can find multiple tutorials, blogs, and articles related to it. You can also look at Great Learning’s free Data Visualization with Python course, and it is a free course and provides fcertificate on completing the course.
Will I get a certificate after completing this Data Visualisation with Python free course?
Yes, you will get a certificate of completion for Data Visualisation with Python after completing all the modules and cracking the assessment. The assessment tests your knowledge of the subject and badges your skills.
How much does this Data Visualisation with Python course cost?
It is an entirely free course from Great Learning Academy. Anyone interested in learning the basics of Data Visualisation with Python can get started with this course.
Is there any limit on how many times I can take this free course?
Once you enroll in the Data Visualisation with Python course, you have lifetime access to it. So, you can log in anytime and learn it for free online.
Can I sign up for multiple courses from Great Learning Academy at the same time?
Yes, you can enroll in as many courses as you want from Great Learning Academy. There is no limit to the number of courses you can enroll in at once, but since the courses offered by Great Learning Academy are free, we suggest you learn one by one to get the best out of the subject.
Why choose Great Learning Academy for this free Data Visualisation with Python course?
Great Learning Academy provides this Data Visualisation with Python course for free online. The course is self-paced and helps you understand various topics that fall under the subject with solved problems and demonstrated examples. The course is carefully designed, keeping in mind to cater to both beginners and professionals, and is delivered by subject experts. Great Learning is a global ed-tech platform dedicated to developing competent professionals. Great Learning Academy is an initiative by Great Learning that offers in-demand free online courses to help people advance in their jobs. More than 5 million learners from 140 countries have benefited from Great Learning Academy's free online courses with certificates. It is a one-stop place for all of a learner's goals.
What are the steps to enroll in this Data Visualisation with Python course?
Enrolling in any of the Great Learning Academy’s courses is just one step process. Sign-up for the course, you are interested in learning through your E-mail ID and start learning them for free online.
Will I have lifetime access to this free Data Visualisation with Python course?
Yes, once you enroll in the course, you will have lifetime access, where you can log in and learn whenever you want to.
Become a Skilled Professional with Pro Courses
Gain work-ready skills with guided projects, top faculty and AI tools, all at an affordable price.


View Course

Included with Pro+ Subscription

View Course

Included with Pro+ Subscription


View Course

Included with Pro+ Subscription

View Course

Included with Pro+ Subscription

View Course

Included with Pro+ Subscription

View Course

Included with Pro+ Subscription
 (1).jpg)
View Course

Included with Pro+ Subscription
.jpg)
View Course

Included with Pro+ Subscription


View Course

Included with Pro+ Subscription


View Course

Included with Pro+ Subscription

View Course

Included with Pro+ Subscription




View Course

Included with Pro+ Subscription


View Course

Included with Pro+ Subscription


View Course

Included with Pro+ Subscription

View Course

Included with Pro+ Subscription


View Course

Included with Pro+ Subscription
View Course

Included with Pro+ Subscription

View Course

Included with Pro+ Subscription
View Course

Included with Pro+ Subscription

View Course

Included with Pro+ Subscription
 (1).png)
View Course

Included with Pro+ Subscription

View Course

Included with Pro+ Subscription

View Course

Included with Pro+ Subscription
.jpg)
View Course

Included with Pro+ Subscription



View Course

Included with Pro+ Subscription


View Course

Included with Pro+ Subscription

View Course

Included with Pro+ Subscription


View Course

Included with Pro+ Subscription

View Course

Included with Pro+ Subscription

View Course

Included with Pro+ Subscription
View Course

Included with Pro+ Subscription

View Course

Included with Pro+ Subscription
.png)
View Course

Included with Pro+ Subscription
 (1).jpg)
View Course

Included with Pro+ Subscription

View Course

Included with Pro+ Subscription
.png)
View Course

Included with Pro+ Subscription

View Course

Included with Pro+ Subscription
.png)
View Course

Included with Pro+ Subscription
.png)
View Course

Included with Pro+ Subscription
.png)
View Course

Included with Pro+ Subscription
.png)
View Course

Included with Pro+ Subscription
.png)
View Course

Included with Pro+ Subscription
.png)
View Course

Included with Pro+ Subscription
.png)
View Course

Included with Pro+ Subscription

View Course

Included with Pro+ Subscription

View Course

Included with Pro+ Subscription
.png)


.png)

View Course

Included with Pro+ Subscription
.png)

View Course

Included with Pro+ Subscription

View Course

Included with Pro+ Subscription

View Course

Included with Pro+ Subscription


.png)
View Course

Included with Pro+ Subscription
Popular


View Course

Included with Pro+ Subscription

View Course

Included with Pro+ Subscription


View Course

Included with Pro+ Subscription

View Course

Included with Pro+ Subscription

View Course

Included with Pro+ Subscription

View Course

Included with Pro+ Subscription
 (1).jpg)
View Course

Included with Pro+ Subscription
.jpg)
View Course

Included with Pro+ Subscription
Microsoft Courses


View Course

Included with Pro+ Subscription


View Course

Included with Pro+ Subscription


View Course

Included with Pro+ Subscription


View Course

Included with Pro+ Subscription


View Course

Included with Pro+ Subscription
IT & Software


View Course

Included with Pro+ Subscription

View Course

Included with Pro+ Subscription


View Course

Included with Pro+ Subscription

View Course

Included with Pro+ Subscription

View Course

Included with Pro+ Subscription

View Course

Included with Pro+ Subscription

View Course

Included with Pro+ Subscription
 (1).png)
View Course

Included with Pro+ Subscription

View Course

Included with Pro+ Subscription

View Course

Included with Pro+ Subscription
View Course

Included with Pro+ Subscription

View Course

Included with Pro+ Subscription
View Course

Included with Pro+ Subscription
.png)
View Course

Included with Pro+ Subscription
.png)
View Course

Included with Pro+ Subscription
.png)
View Course

Included with Pro+ Subscription

View Course

Included with Pro+ Subscription

View Course

Included with Pro+ Subscription
.jpg)
View Course

Included with Pro+ Subscription


View Course

Included with Pro+ Subscription
.png)
View Course

Included with Pro+ Subscription
.png)
View Course

Included with Pro+ Subscription
AI & Generative AI

View Course

Included with Pro+ Subscription

View Course

Included with Pro+ Subscription
.jpg)
View Course

Included with Pro+ Subscription


View Course

Included with Pro+ Subscription


View Course

Included with Pro+ Subscription

View Course

Included with Pro+ Subscription
Data Science & ML


View Course

Included with Pro+ Subscription

View Course

Included with Pro+ Subscription

View Course

Included with Pro+ Subscription

View Course

Included with Pro+ Subscription

View Course

Included with Pro+ Subscription
.png)
View Course

Included with Pro+ Subscription
Management
 (1).jpg)
View Course

Included with Pro+ Subscription

View Course

Included with Pro+ Subscription
.png)
View Course

Included with Pro+ Subscription

View Course

Included with Pro+ Subscription
.png)
View Course

Included with Pro+ Subscription
.png)
View Course

Included with Pro+ Subscription
.png)
View Course

Included with Pro+ Subscription
.png)
View Course

Included with Pro+ Subscription

View Course

Included with Pro+ Subscription
.png)
View Course

Included with Pro+ Subscription
.jpg)
View Course

Included with Pro+ Subscription

View Course

Included with Pro+ Subscription
.jpg)
View Course

Included with Pro+ Subscription
.jpg)
View Course

Included with Pro+ Subscription
.jpeg)
View Course

Included with Pro+ Subscription
View Course

Included with Pro+ Subscription
Cyber Security
.png)
View Course

Included with Pro+ Subscription
.png)
View Course

Included with Pro+ Subscription
.png)
View Course

Included with Pro+ Subscription

View Course

Included with Pro+ Subscription

View Course

Included with Pro+ Subscription
.png)
Cloud Computing


.png)

View Course

Included with Pro+ Subscription
.png)

View Course

Included with Pro+ Subscription


View Course

Included with Pro+ Subscription


View Course

Included with Pro+ Subscription


.png)
View Course

Included with Pro+ Subscription


View Course

Included with Pro+ Subscription
.jpg)

.jpg)

.png)

View Course

Included with Pro+ Subscription

View Course

Included with Pro+ Subscription
Subscribe to Academy Pro+ & get exclusive features
$25/month
No credit card required

Learn from 40+ Pro courses
Access 500+ certificates for free
700+ Practice exercises & guided projects
Prep with AI mock interviews & resume builder
Recommended Free Hindi courses


Similar courses you might like


View Course


