
Power BI Free Course
Power BI Projects
Enrol today and take your data visualization skills to the next level with our free Power BI Projects course! Led by experts in this domain, this course will teach you how to create compelling visualizations and dashboards.
Instructor:
Mr. Vishal Padghan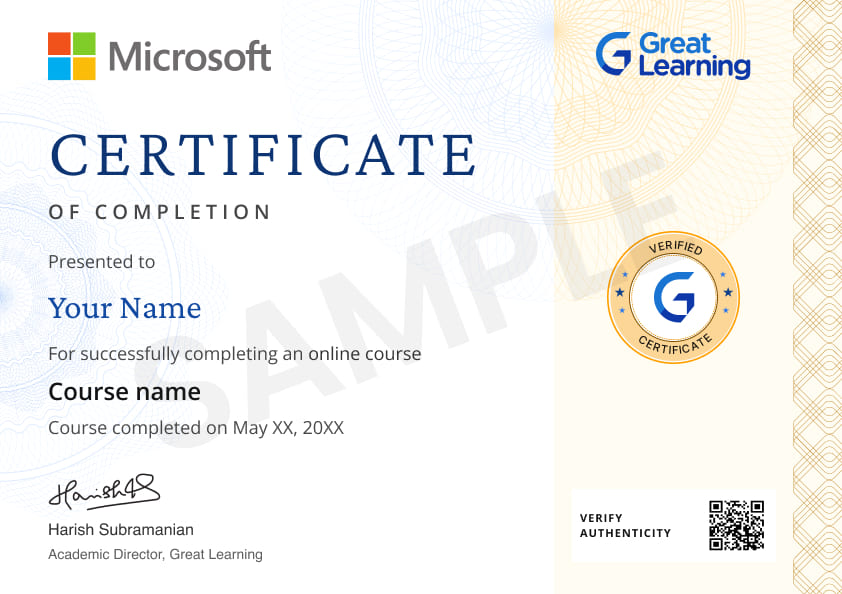
About this course
This free course on Power BI Projects is a great way to get started with this powerful data visualization tool. The course is divided into three parts, each designed to give you the skills you need to create effective data visualizations using Power BI. The first part of the course focuses on getting started with Power BI. You'll learn how to set up your Power BI account, create a workspace, and explore the different tools available in Power BI. You'll also learn how to create your first dashboard and report.
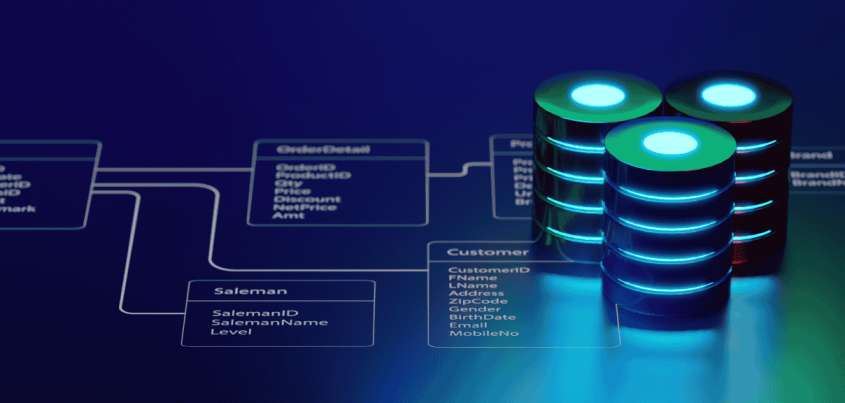
The second part of the course focuses on loading datasets into Power BI. You'll learn how to connect to different data sources and load data into Power BI. You'll also learn how to clean and transform your data to make it more useful for analysis. The third and final part of the course is all about visualizing IPL teams' performance in Power BI. You'll learn how to create different types of visualizations, including tables, charts, and maps, and how to use these visualizations to gain insights into IPL team performance.
By the end of this course, you'll have the skills you need to create effective data visualizations using Power BI. You'll be able to use these skills to analyze data from a variety of sources and gain insights that can help you make better business decisions.
Course outline
Getting Started with Power BI
This module introduces Power BI and covers the basics of data visualization and analysis.
Loading Datasets in Power BI
This module focuses on importing and transforming data in Power BI and covers data modeling concepts.
Visualizing IPL Teams Performance in Power BI
This module shows how to create interactive visualizations and dashboards in Power BI using real-world data from IPL teams.
Get access to the complete curriculum once you enroll in the course
 4.48
4.48
Level up with advanced skills & become job ready with Pro+
Subscribe to Pro+ today to build skills with 50+ Pro courses and prep for jobs with advanced AI tools.


Practice exercises
Certificate from Microsoft
AI Resume Builder
AI mock interviews


 Brazil

 India
India
 India
India
 India
India
 India
India
 India
India
 India
India

 United States
 India
India
 India
India
What our learners enjoyed the most
Skill & tools
67% of learners found all the desired skills & tools
Our course instructor

Mr. Vishal Padghan
Data Science Expert
Frequently Asked Questions
Will I receive a certificate upon completing this free course?
Is this course free?
What are the prerequisites required to learn this Power BI Projects Course?
You do not need any prior knowledge except knowing what Power BI is to learn this Power BI Projects Course.
How long does it take to complete this free Power BI Projects course?
Power BI Projects is a 0.5-hour long course, but it is self-paced. Once you enroll, you can take your own time to complete the course.
Will I have lifetime access to the free course?
Yes, once you enroll in the course, you will have lifetime access to any of the Great Learning Academy’s free courses. You can login and learn whenever you want to.
Will I get a certificate after completing this Power BI Projects Free course?
Yes, you will get a certificate of completion after completing all the modules and cracking the assessment.
How much does this Power BI Projects Course cost?
It is an entirely free course from Great Learning Academy. Anyone interested in learning Power BI Projects can start this course.
Is there any limit on how many times I can take this free course?
No. There is no limit. Once you enroll in the Power BI Projects Course, you have lifetime access to it. So, you can log in anytime and learn it for free online.
Become a Skilled Professional with Pro Courses
Gain work-ready skills with guided projects, top faculty and AI tools, all at an affordable price.


 (1).jpg)
.jpg)


.png)


.png)

.png)
.jpg)
.jpg)
.jpg)

.jpg)
.png)
.png)
.png)

.png)
.png)
.png)
.png)
.png)
.png)


.png)
.png)
.png)
.png)

.png)
.png)

.jpeg)
.jpg)

.png)
.png)
.png)

.png)
.png)
.png)
.jpg)


.png)

 (1).png)


Recommended Free Data Science courses


Similar courses you might like


.jpg)
.jpg)

Related Data Science Courses
-
Scholarships upto ₹15K

Great Lakes Executive Learning
PG Program in Cloud Computing and DevOps8 months · Online
360° Cloud LearningKnow More


